Instantaneous Velocity, Acceleration, Jerk, Slopes, Graphs vs. Time | Doc Physics
Summary
TLDRThis educational video script explores the concepts of velocity and acceleration in physics through graphical representations. It explains how a straight line in a position-time graph indicates constant velocity, while varying slopes suggest changes in speed. The script delves into calculating average velocity, introduces the idea of instantaneous velocity as a limit, and discusses acceleration as the rate of change of velocity. It also humorously introduces 'jerk' as the rate of change of acceleration, relating it to the sensation of balance shifts in everyday scenarios like braking in a car.
Takeaways
- 📈 A straight line in a position versus time graph indicates constant velocity, where the slope represents the rate of change of position over time.
- 🐧 The concept of velocity being the slope of a position-time graph is illustrated using a penguin as an example, emphasizing the physical meaning of the slope.
- 📚 The script suggests watching calculus videos for a deeper understanding of the relationship between calculus and physics, highlighting their interconnectedness.
- 🔍 The constant slope in a velocity-time graph is explained as the marker always being tangent to the line, indicating uniform motion.
- 🤔 The script introduces the idea of calculating velocity between specific time intervals using the rise over run method, which approximates the instantaneous velocity.
- 🎯 The concept of a limit is discussed, defining it as the process of narrowing the time interval to find the instantaneous velocity as delta T approaches zero.
- 📉 The script describes a scenario where the velocity graph is not symmetric, showing how velocity changes over time and eventually becomes negative.
- 🔄 The rate of change of velocity is introduced as acceleration, which is the slope of the velocity-time graph, measured in meters per second squared.
- 🚀 The script proposes the concept of 'jerk' as the rate of change of acceleration, with units of meters per second cubed, relating it to the physical sensation of sudden changes in motion.
- 📊 A table summarizing the units of position, displacement, velocity, acceleration, and jerk is suggested to highlight the pattern of these measurements being divided by time.
- 👋 The video concludes with a teaser for another video, indicating that further explanation and discussion will be provided in a follow-up.
Q & A
What is the physical meaning of the slope in a position versus time graph?
-The slope in a position versus time graph represents the velocity of an object. It is calculated as the change in position (rise) over the change in time (run), which is mathematically expressed as \( V_{average} = \frac{\Delta x}{\Delta t} \).
Why is calculus important in understanding the physics of motion?
-Calculus is important because it was invented to help with problems in physics, such as determining instantaneous velocity and acceleration. It allows for the analysis of rates of change and the behavior of objects at specific points in time.
What does a constant slope in a velocity versus time graph indicate about an object's motion?
-A constant slope in a velocity versus time graph indicates that the object is moving with a constant velocity, meaning there is no acceleration or deceleration occurring.
How can you determine the instantaneous velocity of an object at a specific time?
-The instantaneous velocity can be determined by taking the limit of the change in position over the change in time as the time interval approaches zero (\( \lim_{\Delta t \to 0} \frac{\Delta x}{\Delta t} \)).
What is the concept of acceleration in physics?
-Acceleration is the rate of change of velocity with respect to time. It is calculated as the change in velocity (delta V) over the change in time (delta T), or \( a = \frac{\Delta v}{\Delta t} \).
How does the graph of velocity as a function of time help in understanding an object's motion?
-The graph of velocity versus time shows how the velocity of an object changes over time. It can indicate whether the object is speeding up, slowing down, or moving at a constant speed.
What does a negative velocity indicate in the context of the graph?
-A negative velocity indicates that the object is moving in the opposite direction to the positive reference direction defined in the graph.
What is the term used for the rate of change of acceleration?
-The rate of change of acceleration is referred to as 'jerk,' which is calculated as the change in acceleration (delta a) over the change in time (delta T), or \( j = \frac{\Delta a}{\Delta t} \).
How does the concept of a limit relate to finding instantaneous velocity?
-The concept of a limit is used to find the instantaneous velocity by narrowing the time interval (\( \Delta t \)) to an infinitely small value, thus providing the velocity at a specific instant in time.
Why is the slope of the acceleration graph important?
-The slope of the acceleration graph is important because it represents the rate at which the velocity of an object is changing. A positive slope indicates increasing velocity, while a negative slope indicates decreasing velocity.
What units are used to measure acceleration?
-Acceleration is measured in meters per second squared (\( m/s^2 \)) because it involves the change in velocity (meters per second) over time (seconds).
Outlines

Cette section est réservée aux utilisateurs payants. Améliorez votre compte pour accéder à cette section.
Améliorer maintenantMindmap

Cette section est réservée aux utilisateurs payants. Améliorez votre compte pour accéder à cette section.
Améliorer maintenantKeywords

Cette section est réservée aux utilisateurs payants. Améliorez votre compte pour accéder à cette section.
Améliorer maintenantHighlights

Cette section est réservée aux utilisateurs payants. Améliorez votre compte pour accéder à cette section.
Améliorer maintenantTranscripts

Cette section est réservée aux utilisateurs payants. Améliorez votre compte pour accéder à cette section.
Améliorer maintenantVoir Plus de Vidéos Connexes
Acceleration and Kinematic Equations | Physics in Motion

FISIKA KELAS X: GERAK LURUS (PART 2) Materi dan Contoh Soal GLB dan GLBB

CBSE Class 9 || Physics || Motion || Animation || in English @digitalguruji3147
LEGGE ORARIA e GRAFICO del MOTO RETTILINEO UNIFORME FISICA

Materi GLB & GLBB
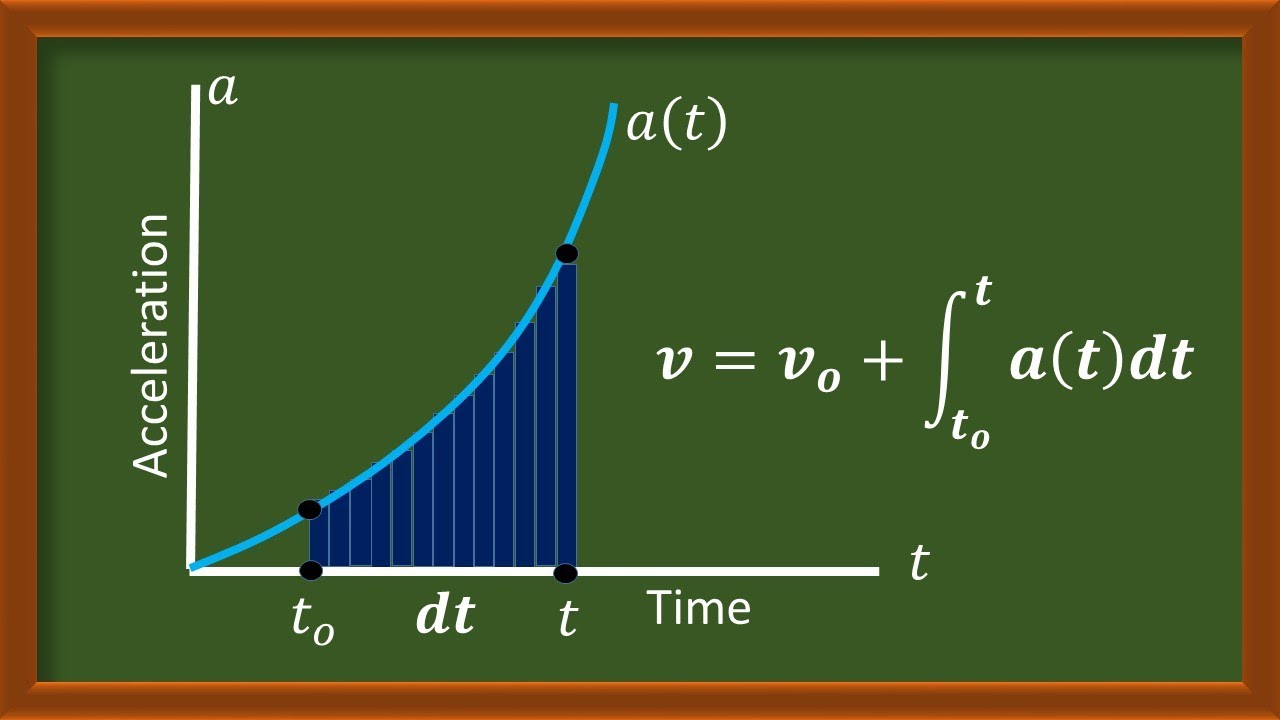
Kinematics: Acceleration Vs Time Graph
5.0 / 5 (0 votes)
