NVDA Stock - NVIDIA Bears Lost Again?
Summary
TLDRIn this Nvidia daily update, the speaker provides an in-depth analysis of Nvidia's stock performance, emphasizing its bullish momentum. Despite a potential bearish candlestick pattern, the market shows strong support for Nvidia, with aggressive buying activity observed in options flow. The key levels to watch are 179-180 for support, and a potential target of 183 for upward movement. The speaker remains optimistic about Nvidia's future, though mentions that cracks may appear if certain indicators show weakness. The video concludes with a note on monitoring daily trends and options flow as the stock continues its bullish trajectory.
Takeaways
- 😀 The Nvidia stock closed up 2% on the day, with a slight after-hours increase due to Meta and Microsoft earnings.
- 😀 Despite a bearish piercing candlestick pattern mentioned earlier, it wasn't confirmed due to a lack of follow-through from the bears.
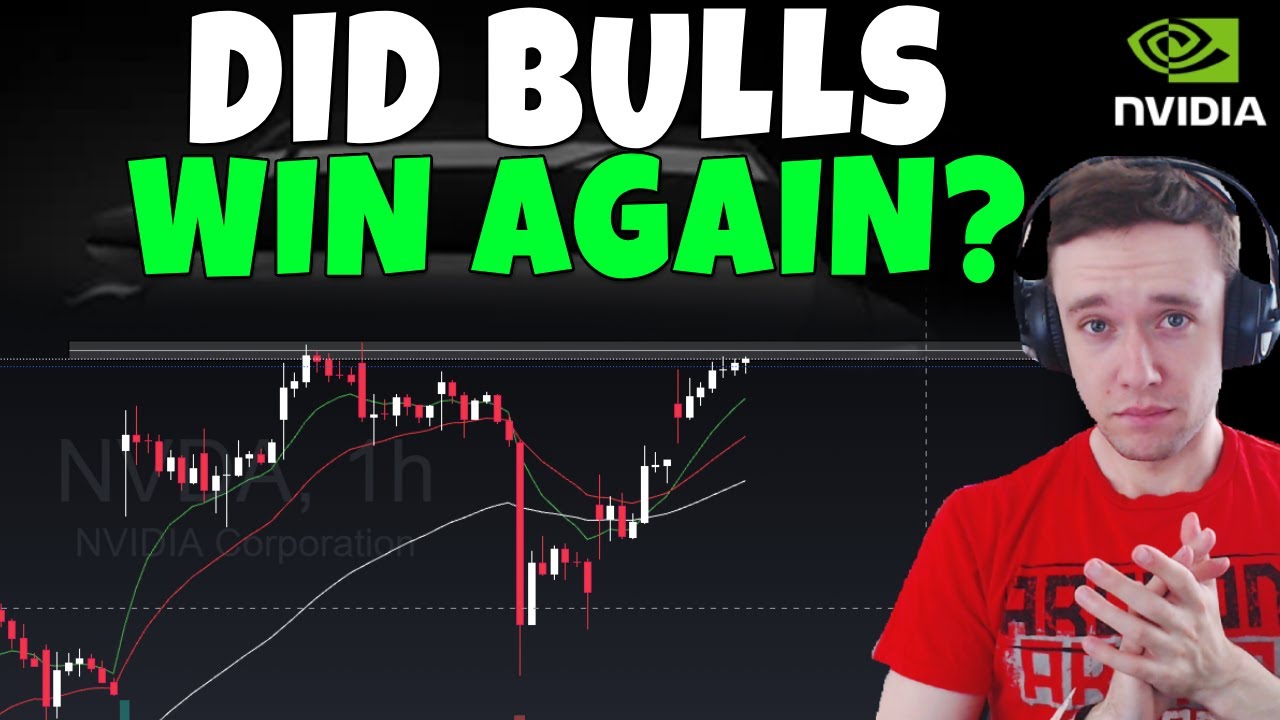
- 😀 The bulls aggressively bought the dip, especially when Nvidia's price dropped to around $178, with notable activity in weekly call options.
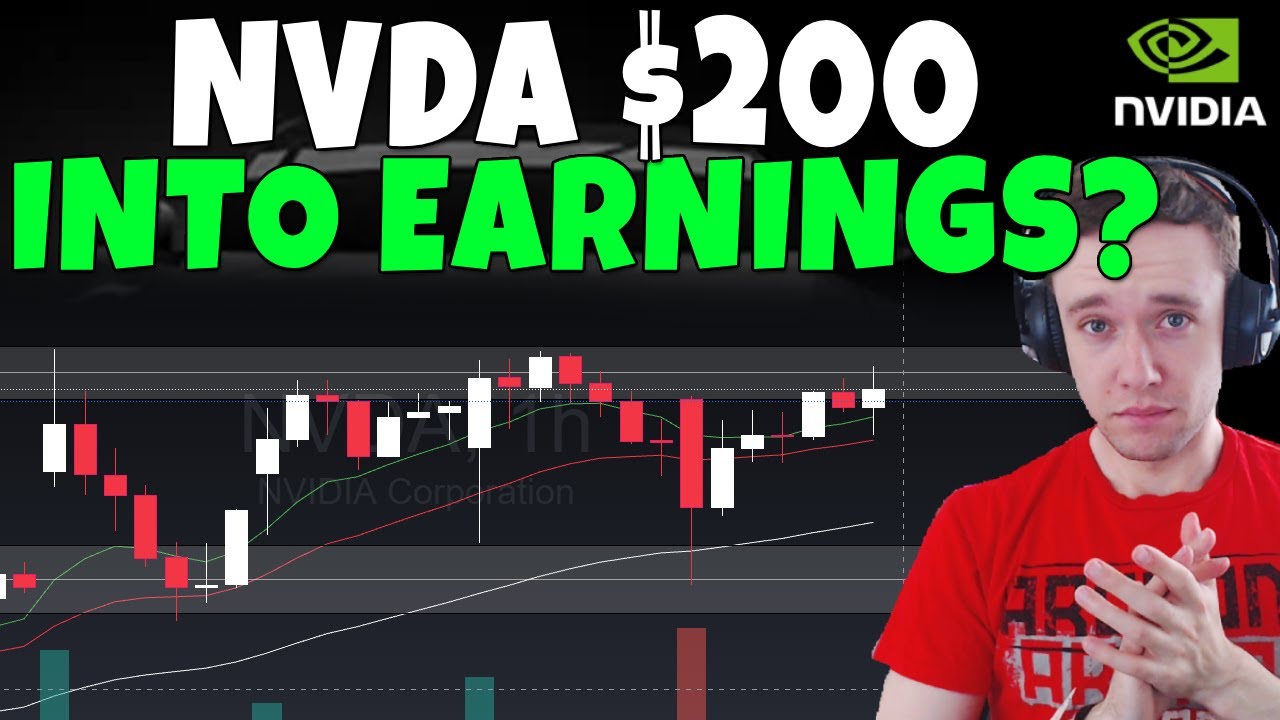
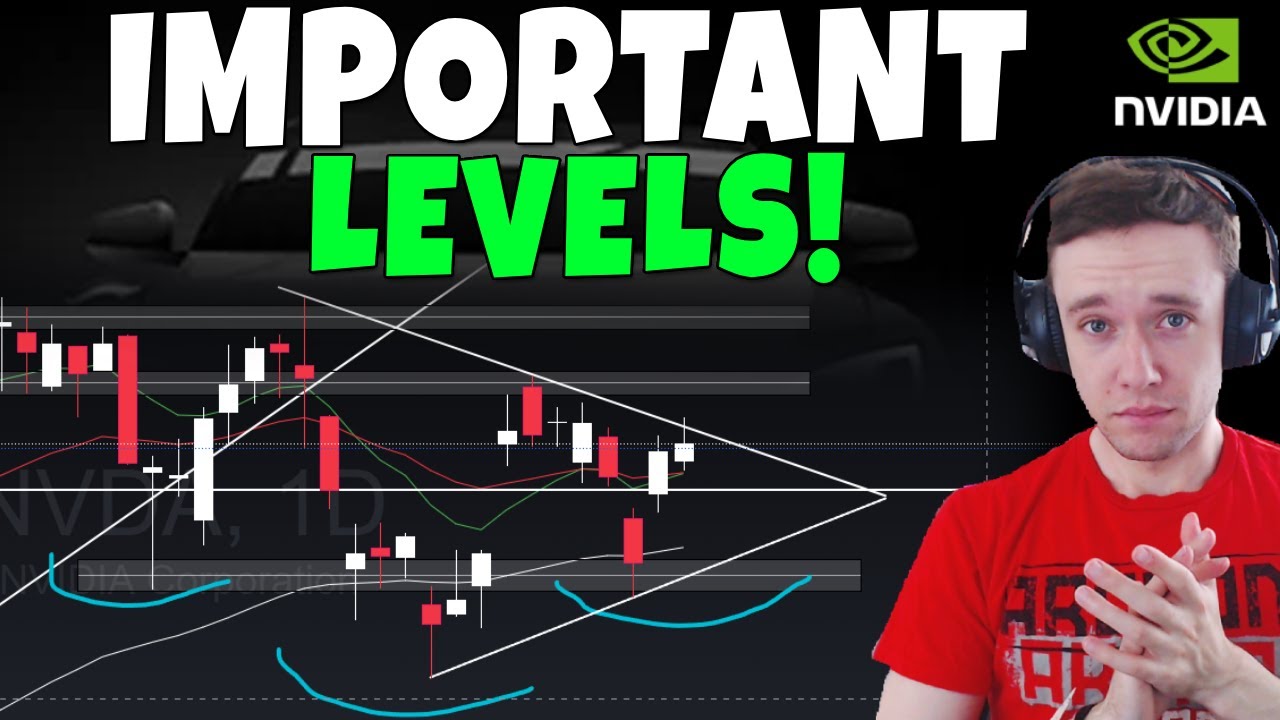
- 😀 A gap up post-earnings has driven Nvidia higher, pushing it above key resistance levels, such as $179–$180, which now act as support.
- 😀 The bulls are still in control of the stock, with key levels of $179–$180 being watched for confirmation of continued upward momentum.
- 😀 Breaking below $177 could raise small red flags, but a larger concern arises if the stock falls below $175, which could signal a pivot to the downside.
- 😀 The overall bullish momentum remains strong, with the stock continuing to test higher highs and not showing significant cracks.
- 😀 The 9 EMA is still solid, and consecutive daily closures below it have not occurred, further indicating bullish sentiment.
- 😀 There is a feeling that the stock might eventually need a breather, but as of now, the bulls are too strong and the stock keeps grinding higher.
- 😀 Even with a potential 1% gap up, the stock is close to testing its target price of around $183, which aligns with the upper trend line.
- 😀 Option flow data has been mostly bullish, with very strong early morning prints, but by the end of the day, it had become more neutral, indicating standard bullishness without excessive optimism.
Q & A
What does the video update primarily focus on?
-The video update focuses on Nvidia stock, analyzing its recent price movements, technical patterns, and future expectations, along with options flow and market sentiment.
What bearish candlestick pattern is mentioned, and why is it considered potentially irrelevant?
-A 'bearish piercing' candlestick pattern is mentioned. However, it is considered potentially irrelevant because there was no confirmation, i.e., no daily close below the previous low, which is necessary to validate the pattern.
What does the speaker suggest is key for confirming technical patterns?
-The speaker suggests that confirmation of technical patterns, like the bearish piercing candle, comes when there is a daily close below the previous low. Without this, the pattern lacks validity.
How did the bulls react to the recent dip in Nvidia stock?
-The bulls reacted aggressively by buying the dip, with significant options flow, including weekly calls, indicating strong bullish sentiment and confidence in Nvidia’s upward movement.
What is the speaker’s outlook on Nvidia’s stock price based on current market trends?
-The speaker remains bullish on Nvidia’s stock, highlighting the absence of bearish confirmation and the strong buying momentum from the bulls. The stock is expected to continue upward as long as certain support levels hold.
What are the key support and resistance levels to watch for Nvidia stock?
-Key support levels are between 179 and 180, with the next major resistance around 183. If Nvidia holds above these levels, the bulls are expected to remain in control.
Why is the 179-180 range considered critical for Nvidia stock?
-The 179-180 range is important because it previously acted as resistance, and now that it’s potentially becoming support, it is a crucial level to watch for signs of continued bullish momentum.
What potential red flags does the speaker mention that could signal a bearish shift in Nvidia stock?
-Potential red flags include a drop below the 177 level, with a more significant concern if the stock falls below 175, as it could indicate a shift to lower lows and a bearish trend.
What is the significance of the MACD indicator in this analysis?
-The MACD indicator is still showing bullish momentum, which supports the idea that the stock remains strong. A bearish flip in the MACD would be a key signal of potential weakness.
What does the speaker suggest about shorting Nvidia stock at this point?
-The speaker advises caution for those looking to short Nvidia stock, as the strong bullish momentum has not shown signs of weakening. While the stock may eventually take a breather, it is still trending upwards and may continue to do so until cracks appear.
Outlines

Cette section est réservée aux utilisateurs payants. Améliorez votre compte pour accéder à cette section.
Améliorer maintenantMindmap

Cette section est réservée aux utilisateurs payants. Améliorez votre compte pour accéder à cette section.
Améliorer maintenantKeywords

Cette section est réservée aux utilisateurs payants. Améliorez votre compte pour accéder à cette section.
Améliorer maintenantHighlights

Cette section est réservée aux utilisateurs payants. Améliorez votre compte pour accéder à cette section.
Améliorer maintenantTranscripts

Cette section est réservée aux utilisateurs payants. Améliorez votre compte pour accéder à cette section.
Améliorer maintenant


5.0 / 5 (0 votes)
