Dispersi Relatif [STATISTIK 1]
Summary
TLDRThis video explains key statistical concepts such as relative dispersion, coefficient of variation, and skewness using practical examples. It highlights how relative dispersion can be used to compare variation between different data sets, such as the lifespan of two lamp brands. The video also covers interpreting skewness, including how to determine whether a distribution is positive or negative, and how quartiles and standard deviations play a role in measuring data spread. It concludes by demonstrating how to interpret various skewness values and their implications on data symmetry.
Takeaways
- 😀 Relative dispersion helps compare the variation between different data sets with different units or scales.
- 😀 The Coefficient of Variation (CV) is used to measure relative dispersion and is calculated by dividing the standard deviation by the mean of the data set.
- 😀 Absolute dispersion measures (range, standard deviation, quartile deviation) describe variation within a single data set but can't compare multiple data sets.
- 😀 In the example of lamp brands, Brand A has a higher coefficient of variation (21.5%) compared to Brand B (17.86%), making Brand B better due to its lower variation.
- 😀 Skewness measures the asymmetry of a data distribution, which can be positive (right-skewed), negative (left-skewed), or zero (symmetrical).
- 😀 A positive skew (right-skewed) means the data has a longer tail on the right, while a negative skew (left-skewed) means the tail is longer on the left.
- 😀 Skewness can be calculated using the formula: 3 * (mean - median) / standard deviation.
- 😀 A perfectly symmetrical distribution has a skewness of zero, meaning the data is evenly distributed around the center.
- 😀 In the calculation of skewness for data with mode 29 and median 34, the result of -0.38 indicates negative skewness, meaning the data is skewed to the left.
- 😀 The smaller the coefficient of variation, the better the consistency or reliability of the data, as it shows less variation in relation to the mean.
Q & A
What is relative dispersion, and why is it important?
-Relative dispersion is a measure used to compare the level of variation or spread between two or more distributions. It is important because it allows for a comparison of variation across different datasets, even when their values or scales are not the same.
How does relative dispersion differ from absolute dispersion?
-Absolute dispersion, like range, average deviation, and standard deviation, describes the variation within a single dataset. In contrast, relative dispersion compares the variation between two or more datasets, making it useful for comparing distributions with different means or scales.
What is the formula for the coefficient of variation (CV)?
-The formula for the coefficient of variation is CV = (Standard Deviation / Mean) × 100%. It measures the relative variability of a dataset compared to its mean.
How do you calculate the coefficient of variation for two lamp brands, A and B?
-To calculate the CV for each brand, divide the standard deviation by the mean for each brand and then multiply by 100%. For Brand A, the result is 21.5%, and for Brand B, it is 17.8%. Since a lower CV indicates less variability, Brand B is considered better due to its smaller CV.
What does a smaller coefficient of variation indicate?
-A smaller coefficient of variation indicates less variability or dispersion relative to the mean, which is considered better in many contexts, such as when comparing the reliability of products like lamps.
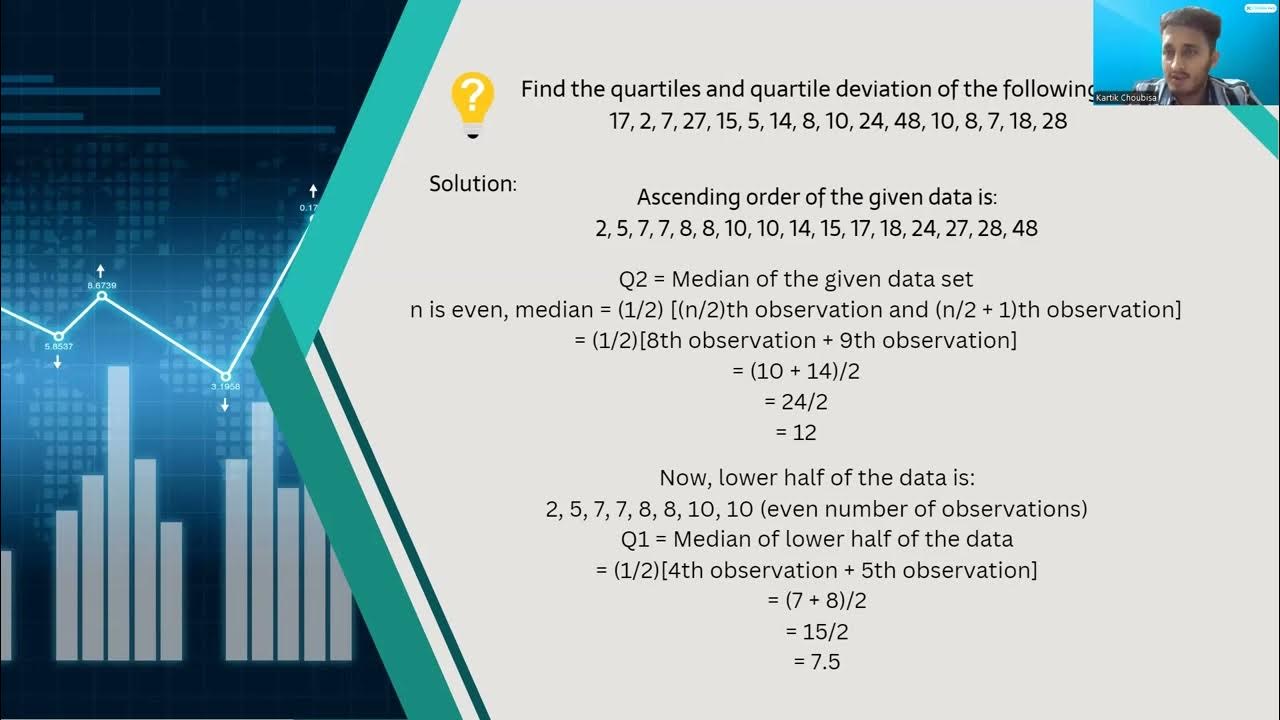
What is the role of quartiles in calculating relative dispersion?
-Quartiles, specifically the first quartile (Q1) and the third quartile (Q3), can be used to calculate measures like the interquartile range (IQR), which in turn can be used for assessing relative dispersion. These measures focus on the middle 50% of the data, providing insight into its spread.
What is skewness in a data distribution?
-Skewness measures the asymmetry of a data distribution. Positive skew indicates a longer right tail, while negative skew indicates a longer left tail. If the distribution is symmetrical, the skewness value is zero.
How can you determine the direction of skewness in a dataset?
-The direction of skewness can be determined by the shape of the data distribution. If the tail is longer on the right side, the skewness is positive (right-skewed). If the tail is longer on the left side, the skewness is negative (left-skewed). A symmetrical distribution has zero skewness.
What does a skewness value of zero indicate?
-A skewness value of zero indicates that the data distribution is perfectly symmetrical, meaning the left and right sides of the distribution are mirror images of each other.
How does the measure of skewness relate to the distribution's shape?
-Skewness is directly related to the distribution's shape. A positive skew means the right tail is longer, and a negative skew means the left tail is longer. A zero skew indicates a perfectly symmetrical distribution, often resembling a normal distribution.
Outlines

Cette section est réservée aux utilisateurs payants. Améliorez votre compte pour accéder à cette section.
Améliorer maintenantMindmap

Cette section est réservée aux utilisateurs payants. Améliorez votre compte pour accéder à cette section.
Améliorer maintenantKeywords

Cette section est réservée aux utilisateurs payants. Améliorez votre compte pour accéder à cette section.
Améliorer maintenantHighlights

Cette section est réservée aux utilisateurs payants. Améliorez votre compte pour accéder à cette section.
Améliorer maintenantTranscripts

Cette section est réservée aux utilisateurs payants. Améliorez votre compte pour accéder à cette section.
Améliorer maintenant


5.0 / 5 (0 votes)
