4. Timeframes
Summary
TLDRIn this video, Pratik Singh explains the concept of time frames in technical analysis for stock charts. He explores the different time frames used by traders and investors, from the long-term monthly charts to short-term intraday charts, detailing how each time frame represents various periods like months, weeks, days, and minutes. Singh emphasizes how multi-timeframe analysis helps develop a comprehensive understanding of stock trends, with each time frame offering a unique perspective. The video is designed to help traders choose the right time frame for their strategy, whether they are long-term investors or day traders.
Takeaways
- 😀 Time frames in technical analysis refer to the intervals at which data (open, high, low, close) is represented on a chart.
- 😀 The monthly time frame shows trends over a long period, making it ideal for long-term investors who want to view major market movements over years or decades.
- 😀 In a monthly chart, each candle represents one month, which allows long-term investors to clearly see the market's long-term trends.
- 😀 The weekly time frame aggregates data for one week per candle, suitable for long-term investors and traders who hold positions for a few months.
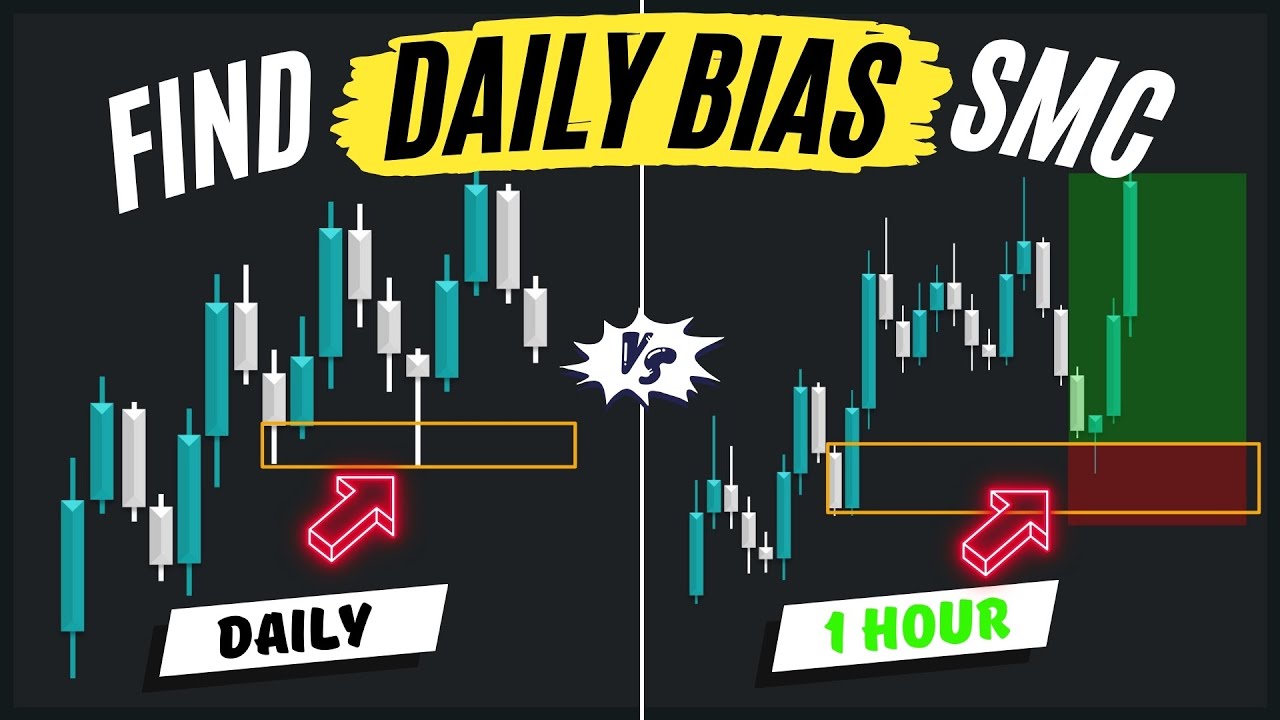
- 😀 The daily time frame is used by traders focusing on shorter-term trends, with each candle representing a single day's data.
- 😀 The intraday time frame includes smaller time periods (e.g., 5, 15, 30 minutes) and is ideal for day traders who need to analyze minute-to-minute movements in the market.
- 😀 The 30-minute time frame offers an overview of intraday movements, while the 5-minute time frame provides a more granular perspective on short-term fluctuations.
- 😀 Multi-time frame analysis helps traders and investors develop a comprehensive view of the market by evaluating trends on different scales (e.g., daily, weekly, monthly).
- 😀 By analyzing a stock in multiple time frames, you can get different perspectives on its trend, such as short-term versus long-term trends.
- 😀 There's no single 'correct' time frame to use; the best time frame depends on your investment or trading strategy and your horizon for holding positions.
- 😀 For a more refined approach, it's useful to look at various time frames in conjunction to develop a clearer understanding of market movements and trends.
Q & A
What is the significance of using different time frames in technical analysis?
-Different time frames help traders and investors analyze price movements over varying periods, allowing them to tailor their strategies for short-term trades or long-term investments.
What does a monthly time frame represent in technical analysis?
-A monthly time frame represents one candlestick for each month, showing the open, high, low, and close of the stock during that month. It is typically used by long-term investors to analyze trends over several years or decades.
How does a weekly time frame differ from a monthly time frame?
-A weekly time frame represents one candlestick for each week, with 52 candles in a year. It provides more detailed short-term trends compared to the monthly time frame, which is often used for longer-term trend analysis.
What is the purpose of using a daily time frame in technical analysis?
-The daily time frame shows price movements for each day, with one candlestick per day. It is used by traders who focus on short-term market trends, typically holding positions for days to weeks.
How do intraday time frames differ from other time frames?
-Intraday time frames (such as 30-minute, 15-minute, or 5-minute charts) break down the day into smaller intervals, offering highly granular data for day traders. These time frames provide insights into immediate price actions within the trading day.
What can multi-time frame analysis reveal to traders?
-Multi-time frame analysis helps traders gain a more comprehensive view of market trends by comparing price movements across various time frames (e.g., daily, weekly, monthly). It helps refine decisions by showing trends from different perspectives.
Why is the monthly time frame preferred by long-term investors?
-Long-term investors prefer the monthly time frame because it allows them to observe macro trends over several years or decades, making it easier to identify significant price movements and long-term growth potential.
What is the typical time horizon for traders using the weekly time frame?
-Traders using the weekly time frame typically have a medium-term investment horizon, ranging from a few weeks to several months, as this time frame offers a balanced view of price movements.
How do the number of candles in a time frame affect trend visibility?
-The more candles present in a time frame, the more detailed the price action becomes. For example, a monthly chart has fewer candles and shows long-term trends, while daily and intraday charts have more candles and highlight shorter-term movements.
What factors should traders consider when choosing the appropriate time frame for their analysis?
-Traders should consider their investment strategy, whether they are focused on long-term growth or short-term trades. They should also take into account the amount of detail they need, with longer time frames providing broader trends and shorter time frames offering finer granularity.
Outlines

Cette section est réservée aux utilisateurs payants. Améliorez votre compte pour accéder à cette section.
Améliorer maintenantMindmap

Cette section est réservée aux utilisateurs payants. Améliorez votre compte pour accéder à cette section.
Améliorer maintenantKeywords

Cette section est réservée aux utilisateurs payants. Améliorez votre compte pour accéder à cette section.
Améliorer maintenantHighlights

Cette section est réservée aux utilisateurs payants. Améliorez votre compte pour accéder à cette section.
Améliorer maintenantTranscripts

Cette section est réservée aux utilisateurs payants. Améliorez votre compte pour accéder à cette section.
Améliorer maintenantVoir Plus de Vidéos Connexes

Jenis-jenis Chart Saham untuk Trading | feat. Michael Yeoh

It's Very Easy Top Down Analysis

Stock Chart Analysis with GPT4o Omni (Python Tutorial)

Types of Charts Used in Technical Analysis

Weekend Market Analysis | September 3rd Week | Swing Trading | Stock Market Education

Best Daily Bias Trading Strategy SMC
5.0 / 5 (0 votes)
