Process Mapping

LeanOhio
23 Nov 201604:44

Summary

TLDRProcess mapping is a visual tool that makes the invisible office processes visible, allowing for analysis and improvement. It involves identifying each step, the job function responsible, and the flow from suppliers to customers. A value stream map provides a macro-level view, while detailed mapping uses color-coded Post-it notes to represent different process elements. This method was successfully applied by the Bureau of Criminal Investigation to enhance their DNA analysis process, leading to faster criminal apprehension and swift justice.

Takeaways

  • 🔍 **Process Mapping Reveals Invisible Workflows**: It makes the typically unseen processes in an office environment visible and analyzable.
  • 🏭 **Manufacturing vs. Office Processes**: While manufacturing processes are more tangible, office processes often remain hidden and unexamined.
  • 🚀 **Improvement Through Visibility**: Process mapping allows for the identification of inefficiencies and waste, leading to targeted improvements.
  • 📈 **Starting with a SIPOC Diagram**: This high-level diagram outlines the process's suppliers, inputs, outputs, customers, and scope.
  • đŸ‘„ **Engagement of Process Owners**: Those who work in the process should be involved in mapping it to ensure accuracy and buy-in.
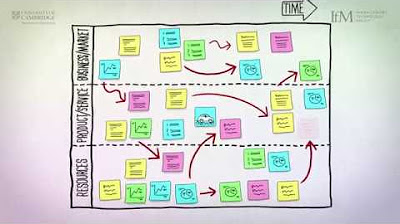
  • 🎹 **Visual Exercise with Physical Space**: A large space and visual tools like Post-it notes are used to organize and visualize each step of the process.
  • 📝 **Verb Noun Format for Steps**: Steps should be written in a clear, actionable format to facilitate understanding and improvement.
  • 🌈 **Color Coding for Clarity**: Different colors of Post-it notes represent different aspects of the process, such as steps, decisions, and delays.
  • 🔗 **Connecting Steps with Arrows**: Straight arrows for tasks by the same function, box arrows for handoffs, and jagged arrows for electronic transfers.
  • 🔍 **Analyzing for Value and Waste**: After mapping, identify value-added activities and non-value added steps, including those mandated by regulation.
  • 💡 **Real-World Success Story**: The Bureau of Criminal Investigation used process mapping to improve their DNA analysis process, leading to faster results and increased efficiency.

Q & A

  • What is the primary purpose of process mapping?

    -The primary purpose of process mapping is to make the invisible processes visible, allowing us to understand them, identify inefficiencies and waste, and take steps to improve them.

  • Why are manufacturing processes more visible compared to office processes?

    -Manufacturing processes are more visible because they involve tangible transformations of raw materials into finished products that can be seen, whereas office processes are often intangible and not easily observed.

  • What does a SIPOC diagram represent in the context of process mapping?

    -A SIPOC diagram represents the macro level big picture of a process, identifying the suppliers, inputs, outputs, and customers of the process, as well as the scope of the process.

  • Who should be involved in the process mapping exercise?

    -The people who work in the process should be the ones doing the process mapping, as they have direct knowledge and experience with the process.

  • Why is ample space important for process mapping?

    -Ample space is important for process mapping to organize each piece of the process visually and to allow for the placement and rearrangement of Post-it notes representing each step.

  • What is the significance of using different colors of Post-it notes in process mapping?

    -Using different colors of Post-it notes helps to visually distinguish between various elements of the process, such as functional areas, decision points, and delays, making the process map easier to understand.

  • How should the steps of a process be written on Post-it notes during mapping?

    -The steps should be written in a verb-noun format, which clearly describes the action and the object involved in each step.

  • What symbols are used to represent different types of steps in a process map?

    -Straight arrows are used to connect steps within the same function, box arrows represent handoffs between functions, and jagged arrows indicate electronic handoffs.

  • What are the three types of activities identified during the analysis of a process map?

    -The three types of activities identified are value-added activities, non-value added activities, and non-value added but necessary steps.

  • How did the Bureau of Criminal Investigation benefit from process mapping?

    -The Bureau of Criminal Investigation benefited from process mapping by improving their DNA analysis process, leading to faster results, criminals being taken off the streets sooner, and swifter justice.

  • Where can one find more information on process mapping and its benefits?

    -More information on process mapping and its benefits can be found on the website lean.ohio.gov under the resources tab.

Outlines

00:00

📈 Process Mapping: Visualizing Workflows

Process mapping is a technique used to make the invisible processes visible, allowing for a better understanding and analysis of how work is done. It's particularly useful in office environments where the flow of work is often not apparent. The process involves mapping out all the steps of a process and identifying the job functions that complete each step. This visual exercise helps identify inefficiencies and areas for improvement. It often starts with a SIPOC diagram to illustrate the big picture, including suppliers, inputs, outputs, and customers. The actual process mapping is done on a large scale, using Post-it notes of different colors to represent different elements of the process, such as steps, decisions, and delays. The goal is to analyze the map for value-added activities, non-value-added activities, and waste, with the aim of simplifying and improving the process for better customer value. An example of successful process mapping is the Bureau of Criminal Investigation's improvement of their DNA analysis process, leading to faster results and swifter justice.

Mindmap

Keywords

💡Process Mapping

Process mapping is a visual representation of the steps involved in a process. It helps make invisible office processes more visible and understandable by identifying inefficiencies and areas for improvement. In the video, it is emphasized as a way to see the entire process flow, making it easier to identify waste and streamline operations.

💡Inefficiencies

Inefficiencies refer to steps in a process that waste resources, time, or effort without contributing value. The video highlights the importance of identifying inefficiencies through process mapping, allowing teams to take action to improve the process and eliminate wasteful practices.

💡Waste

Waste in the context of process mapping refers to activities that do not add value to the final product or service. These can be delays, rework, or unnecessary handoffs. The video encourages identifying and eliminating waste to create a leaner, more efficient process.

💡Swim Lane Diagram

A swim lane diagram is a type of process map that visually separates the steps of a process into functional areas, represented by horizontal bands or 'swim lanes.' This helps identify which department or role is responsible for each step. The video explains how using swim lanes helps clarify handoffs and ensures each step is placed within the correct functional area.

💡Functional Areas

Functional areas refer to different departments or roles involved in a process. In the video, it is explained that process mapping involves determining these areas and assigning each step of the process to the appropriate swim lane, ensuring responsibility is clear.

💡CYPO Diagram

A CYPO diagram (Customers, Inputs, Process, Outputs) is a high-level process map that outlines the big picture, including suppliers, inputs, outputs, and customers of the process. It is often used as a starting point for process mapping, as mentioned in the video, to capture the overall scope before diving into detailed steps.

💡Post-it Notes

Post-it notes are used in process mapping to capture each step of the process in a visual, flexible format. Different colors represent different functions, such as steps, decisions, or delays. The video emphasizes how color-coded Post-it notes make the process more visible and easier to analyze.

💡Handoffs

Handoffs refer to the transition of work or information from one person or department to another. The video highlights how process mapping can help identify handoffs, especially inefficient or unnecessary ones, so that they can be optimized or eliminated.

💡Value-Added Activities

Value-added activities are steps in a process that directly contribute to transforming materials or information into a product or service that the customer wants. The video stresses the importance of distinguishing these from non-value-added activities during the process mapping exercise.

💡Non-Value Added Activities

Non-value-added activities are tasks that consume resources without adding value to the product or service. While some are necessary due to regulations, others represent waste and should be minimized. The video encourages identifying these activities during process mapping to streamline processes.

Highlights

Making the invisible visible through process mapping is crucial for understanding and improving workflows.

In manufacturing, processes are more visible, but in office environments, they often remain unseen and unanalyzed.

Process mapping allows for a comprehensive view of a process to identify inefficiencies and waste.

Mapping involves visualizing all steps of a process and identifying the job function that completes each step.

Process mapping begins with a SIPOC diagram, illustrating the macro level view of the process.

The SIPOC diagram identifies suppliers, inputs, outputs, customers, and the scope of the process.

Process mapping should involve the people who work in the process to ensure accuracy and buy-in.

A large piece of paper or wall space is needed to map out the process visually.

Functional areas involved in the process should be identified and mapped with horizontal bands or Swim Lanes.

Post-it notes are used to write and organize steps in a verb-noun format.

Color-coded Post-it notes help to visually distinguish different types of steps and activities.

Single straight arrows are used to connect steps within the same functional area.

Handoffs between functions are shown with box arrows, while electronic handoffs use jagged arrows.

Once the map is drawn, analyze it for value-added activities and areas of improvement.

Identify non-value added activities that use resources but do not contribute to the final product or service.

Distinguish between necessary non-value added steps and those that could be eliminated.

The Bureau of Criminal Investigation used process mapping to improve their DNA analysis process.

Process mapping can lead to faster results, criminals being taken off the streets sooner, and swift justice.

For more information on process mapping, visit lean.ohio.gov and click on the resources tab.

Transcripts

play00:00

making the invisible visible that's

play00:03

process mapping our processes are

play00:06

typically invisible to us it's just what

play00:08

we do in manufacturing processes are

play00:12

bolted to the floor and much more

play00:14

visible you can actually see raw

play00:16

materials being transformed into a

play00:18

finished product but often in an office

play00:21

environment we never know the whole flow

play00:24

and never take a step back to look at

play00:26

the process as a whole and really

play00:28

analyze it to make it better

play00:31

so why should we process map it allows

play00:34

us to look at a process understand it

play00:37

and identify inefficiencies and waste so

play00:40

that we can begin to take steps to

play00:42

improve the

play00:43

process mapping all the steps of a

play00:46

process and identifying the job function

play00:48

that completes each step allows us to

play00:51

identify areas for

play00:53

improvement process mapping is bold and

play00:55

visual helping to make the process

play00:58

visible

play01:00

often process mapping begins with a cypo

play01:04

diagram which illustrates the macro

play01:06

level big picture and has identified the

play01:09

suppliers inputs outputs and customers

play01:12

of the process and importantly the scope

play01:15

of the

play01:16

process the people who work in the

play01:19

process should be the people who are

play01:20

doing the process

play01:22

mapping process mapping is a visual

play01:25

exercise and requires ample space to

play01:27

organize each piece of the process

play01:31

start with a large piece of paper placed

play01:33

on a large

play01:34

wall next you'll want to determine the

play01:37

functional areas those that do something

play01:39

in the

play01:40

process identify a horizontal band or

play01:43

Swim Lane for each functional area

play01:45

involved in the

play01:47

process alternatively you can start with

play01:50

the first functional area and begin

play01:52

mapping the process adding other

play01:53

functional areas in their own swim Lane

play01:55

as you arrive at those

play01:58

steps start with the first step and ask

play02:01

what comes next write each step in a

play02:04

verb noun

play02:05

format have participants write the steps

play02:08

on Post-it

play02:09

notes Place each note on the process map

play02:13

in order and in correct swim Lane move

play02:16

the notes around until the group is

play02:18

satisfied that all steps have been

play02:20

identified and that each step is in the

play02:22

correct

play02:24

order using colorcoded Post-it notes

play02:27

helps to make the process visible for

play02:29

examp example beginning and ending

play02:31

points of the process use green Post-it

play02:34

notes pink Post-it notes are used to

play02:37

identify functional

play02:39

areas any task activity where work is

play02:42

performed use yellow Post-it notes use

play02:45

blue Post-it notes turned into a diamond

play02:47

shape to indicate a decision point which

play02:50

will lead to a separate path or set of

play02:53

steps use purple Post-it notes anytime

play02:56

there is a wait or delay before the next

play02:58

step or decision

play03:01

next you will connect the steps in one

play03:04

swim Lane with single straight

play03:06

arrows single straight arrows are used

play03:09

between tasks performed by the same

play03:11

person work unit or

play03:13

function handoffs between functions are

play03:16

shown with box arrows and electronic

play03:19

handoffs are shown with Jagged arrows

play03:21

once the process map is drawn it's time

play03:24

to analyze it for potential areas of

play03:26

process

play03:27

Improvement Begin by ident identifying

play03:30

value added activities those that

play03:32

transform materials and information into

play03:35

products or services that the customer

play03:38

wants identify nonv value added

play03:41

activities those that use resources but

play03:43

do not directly contribute to the

play03:45

product or

play03:47

service identify nonv value added

play03:49

activities but necessary steps those

play03:52

that are non-value added but mandated by

play03:55

regulation rules or statute and cannot

play03:58

be changed unless the regulation has

play04:01

changed identify waste rework handoffs

play04:05

and things that could be eliminated from

play04:07

the process to make it simpler and of

play04:09

more value to the customer the Bureau of

play04:12

criminal investigation successfully

play04:14

utilized process mapping to improve

play04:16

their DNA analysis process and deliver

play04:19

faster results which led to criminals

play04:21

being taken off the streets sooner and

play04:24

Justice delivered

play04:26

swiftly for more information regarding

play04:28

process mapping and how it can help you

play04:30

make improvements visit lean.

play04:34

ohio.gov and click on the resources

play04:42

tab

Rate This
★
★
★
★
★

5.0 / 5 (0 votes)

Étiquettes Connexes
Process MappingEfficiencyManufacturingOfficeImprovementWorkflowLeanDNA AnalysisCriminal JusticeLean Ohio
Besoin d'un résumé en anglais ?