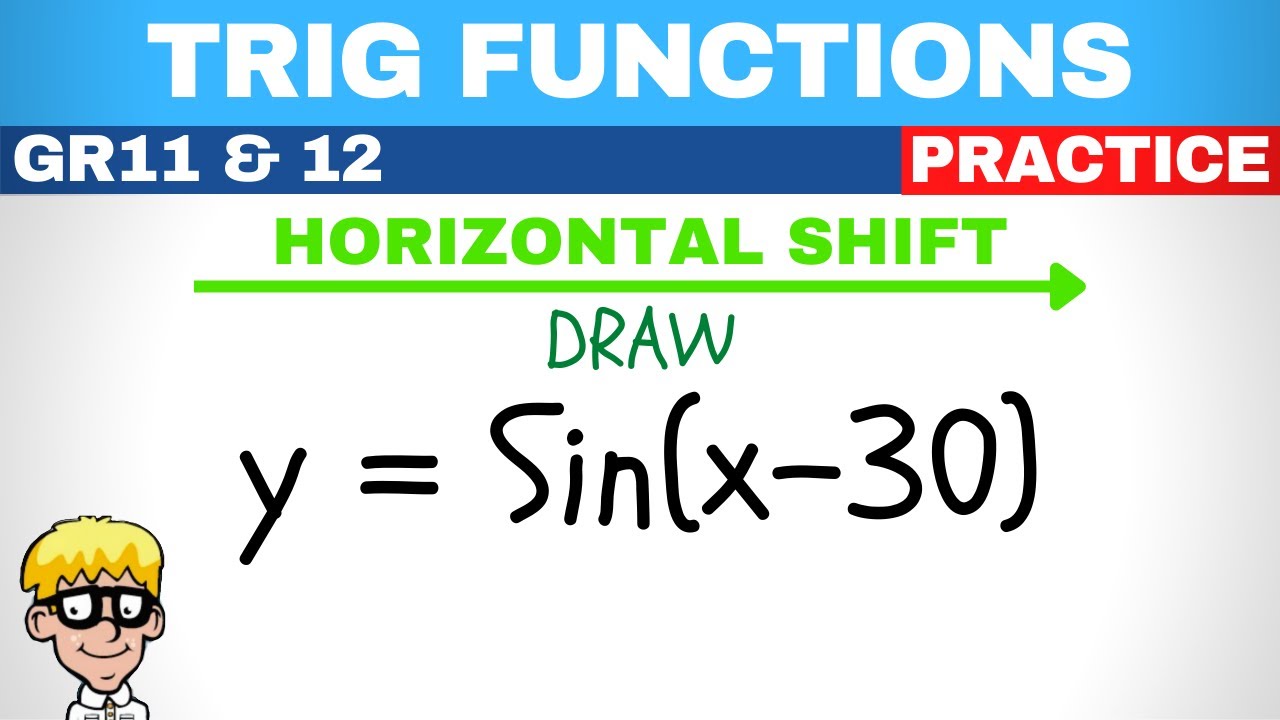
Trig functions grade 11 and 12: Horizontal stretch
Summary
TLDRIn this educational video, the focus is on transforming graphs by stretching or compressing them, specifically using the sine function. The instructor explains how the coefficient in front of 'x' in a sine function affects the period of the graph. For instance, 'sin(2x)' halves the period from 360 degrees to 180 degrees, as each x-value is doubled. The tutorial demonstrates how to adjust the calculator's settings, including the step size, to accurately graph 'sin(2x)'. The instructor also covers key concepts like amplitude, range, domain, and period, providing a clear visual comparison between a standard sine graph and the transformed one.
Takeaways
- đ The lesson focuses on transforming graphs by stretching or compressing them, which can also be referred to as compressing.
- đ In previous lessons, the movement of graphs was discussed, such as shifting a graph upwards, moving all points in the same direction.
- đ The new topic is the effect of mathematical operations like '2x' on the graph of a sine function, which stretches or compresses the graph horizontally.
- đ When '2x' is applied to a sine function, it compresses the graph horizontally, causing it to complete its cycle in half the original period.
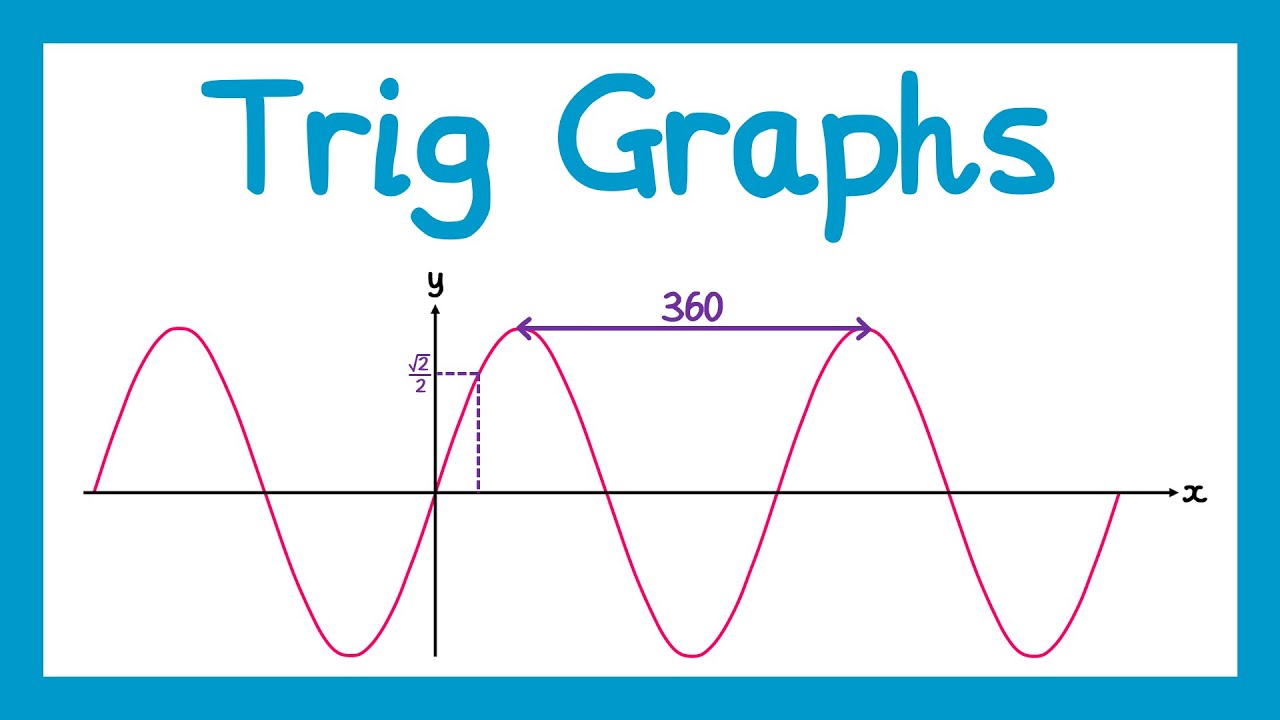
- đ The normal period for a sine or cosine graph is 360 degrees, but with '2x', the period becomes 180 degrees, as explained by the rule 360 divided by the coefficient of 'x'.
- đą The step size on the calculator for graphing 'sin(2x)' should be set to 45 degrees, which is 180 divided by 4, to properly display the graph's shape.
- đ The amplitude of the 'sin(2x)' graph remains the same as the original sine graph, which is the maximum distance from the resting position (equilibrium line).
- đ The range of the 'sin(2x)' graph is between -1 and 1, as these are the minimum and maximum y-values of the sine function.
- đ The domain of the 'sin(2x)' graph is from -180 to 360, as specified in the lesson, which indicates the x-values over which the graph is drawn.
- đ The 'sin(2x)' graph completes two cycles within the 360-degree range, which is a key observation for understanding the effect of '2x' on the graph.
Q & A
What is the main focus of the lesson described in the transcript?
-The main focus of the lesson is to understand how graphs, specifically sine graphs, are affected when they are stretched or compressed.
What does the term 'stretching' a graph refer to in this context?
-In this context, 'stretching' a graph refers to the process of enlarging the graph by altering its equation, which can result in the graph covering more space in fewer cycles.
How does the point (0, 0) on a sine graph move when the graph is stretched?
-When a sine graph is stretched, the point (0, 0) would move vertically up or down depending on the nature of the stretch, but the starting point on the x-axis remains the same.
What is the effect of the term '2x' in the equation of a sine graph on the period of the graph?
-The term '2x' in the equation of a sine graph halves the period of the graph. If the normal period for a sine graph is 360 degrees, with '2x', the new period becomes 180 degrees.
Why is the step size important when graphing a stretched or compressed sine function on a calculator?
-The step size is important because it determines the resolution of the graph. If the step size is too large, the graph may not accurately represent the function's shape, especially after transformations like stretching or compressing.
What is the new step size for a sine graph with the equation 'sin(2x)' as compared to a standard sine graph?
-For a standard sine graph, the step size is typically 90 degrees. However, for a graph with the equation 'sin(2x)', the new step size should be 45 degrees to accurately represent the halved period.
How does the amplitude of a sine graph change when the graph is stretched or compressed?
-The amplitude of a sine graph does not change when the graph is stretched or compressed horizontally. The amplitude remains the maximum distance from the resting position (equilibrium line) to the peak or trough of the graph.
What is the resting position referred to in the context of a sine graph?
-The resting position in the context of a sine graph refers to the equilibrium line, which is the horizontal line where the graph would be at rest, typically the x-axis.
How does the domain of a sine graph change when it is stretched or compressed?
-The domain of a sine graph, which represents the set of x-values, does not change when the graph is stretched or compressed. It remains the same as specified in the problem or the original function.
What is the range of a sine graph with the equation 'sin(2x)' if the original range is between -1 and 1?
-The range of a sine graph with the equation 'sin(2x)' remains between -1 and 1, as the stretching or compressing affects the period and not the amplitude.
How can you remember the rule for calculating the new period of a sine graph when the equation includes a coefficient in front of 'x'?
-You can remember the rule by knowing that the period of a sine or cosine graph is always 360 degrees divided by the number in front of 'x'. So for 'sin(2x)', the new period is 360 degrees divided by 2, which equals 180 degrees.
Outlines
đ Introduction to Stretching and Compressing Graphs
This paragraph introduces the concept of stretching and compressing graphs, which is a shift from the previous lessons that focused on graph translations. The instructor explains that stretching or compressing can alter the appearance of a graph, such as a sine graph, by enlarging or reducing its scale. The example given is the transformation of a graph by the function 'y = sin(x)' into 'y = sin(2x)', which results in a graph that completes its cycle in half the period of the original, thus changing the graph's frequency. The instructor emphasizes the importance of understanding how the coefficient in front of 'x' affects the period of the graph, which is crucial for setting the correct step size on a calculator when graphing. The new period is calculated as 360 (the standard period for sine and cosine graphs) divided by the coefficient of 'x'. The instructor also demonstrates how to input the equation into a calculator, set the correct table mode, and determine the appropriate step size to accurately graph the function 'y = sin(2x)'.
đ Analyzing the Effects of '2x' on a Sine Graph
In this paragraph, the focus is on the specific effects of the '2x' term in the sine function. The instructor clarifies that doubling 'x' does not double the graph's period but rather halves it. This is a common misconception that the instructor addresses by explaining that the 'x' term complicates the graph's behavior. The new period for 'y = sin(2x)' is 180 degrees, which is half of the standard 360-degree period for a sine graph. The instructor provides a visual demonstration of the graph's transformation, showing how the graph completes two cycles within the usual 360-degree span. The amplitude, range, and domain of the graph are also discussed, with the amplitude remaining at one and the range spanning from -1 to 1. The domain is specified as the interval from -180 to 360 degrees. The instructor concludes by reiterating the importance of understanding the impact of the 'x' term on the graph's period and shape.
Mindmap
Keywords
đĄStretch
đĄCompress
đĄGraph Transformation
đĄTrigonometric Functions
đĄPeriod
đĄAmplitude
đĄDomain
đĄCalculator
đĄStep
đĄResting Position
Highlights
Introduction to stretching and compressing graphs, which can also be referred to as compressing.
Explanation of how moving a graph upwards affects all points on the graph.
Transition to studying the effects of stretching or compressing a graph.
Illustration of how stretching a graph results in a larger cycle in the same space.
Example of compressing a graph to show a smaller cycle within the same space.
Emphasis on using a calculator to explore these graph transformations.
Instruction to set the calculator to table mode for graphing.
Importance of using the given start and end points for graphing.
Explanation of the significance of the '2x' term in altering the graph's period.
Rule for calculating the new period when a coefficient is in front of 'x' in a trigonometric function.
Clarification that '2x' halves the period of the graph, contrary to initial expectations.
Demonstration of how to adjust the step size on the calculator for the new period.
Tabulation of values using the adjusted step size for the transformed graph.
Visualization of the transformed graph by plotting the calculated points.
Comparison of a normal sine graph with the transformed graph to show the difference in cycle completion.
Discussion on the amplitude of the graph, which is the maximum distance from the resting position.
Definition of the range of the graph as the set of y-values between the minimum and maximum.
Explanation of the domain of the graph, which are the given x-values.
Final note on the period of the sine function when '2x' is present, emphasizing the halving effect.
Conclusion and appreciation for watching the lesson.
Transcripts
hello everyone welcome to this lesson so
in this lesson we're moving on to
something slightly different now we're
going to be stretching the graphs okay
but when i say stretch it could also
mean compress
so in the previous videos we've been
looking at questions where you have
graphs for example a syn graph that then
gets moved upwards so for example this
point moves over here
and this point moves up and this point
moves up
and so all of the points were moved up
and so the graph did that
but what we're going to start looking at
now is what happens when we compress or
stretch a graph so for example if we
take this original graph that we see
here and we
we enlarge it by stretching it like that
for example
or we could compress it so it would look
something like this
see so in the space of
the white graph doing one cycle the blue
one has done two so that's what we're
going to look at in this
when the this lesson and the next couple
of lessons so as always you're just
going to do this on the calculator and
so let's get started so we're going to
bring out the calculator and then just
always remember to put it into table
mode you then type in the equation
remember your start must always be the
start that they've given you which is
minus 180 the ending point is what
they've given us in this question which
is 360. now the step is very important
so we know that the step of a normal syn
graph or sorry the period of a normal
syn graph under usual conditions is 360.
but now
this 2x over here we need to know what
that does to the graph so x's are
they complicated okay you can even think
about it in if you wanted to uh just
came to mind now uh having
ex-girlfriends having ex-boyfriends
that's complicated if you have a graph
that is
for example the sun of x minus 30 that
actually causes the graph to go 30
degrees to the right not to the left as
we would expect if we have a graph that
is now the sun of 2x well logically the
every person would expect that that
doubles the graph but that's not true
because remember x's are complicated and
so
2x is actually going to cause the graph
to
half and so instead of having so if your
original graph looks like that the 2x
graph is now going to be completely
half of that okay so every point is
going to halve so if your period of a
normal centigraph is 360 well this new
graph is going to be completing in 180
degrees so here's a little rule that you
can remember you can remember that the
period
is always going to be equal to 360 for a
sin and cos graph divided by whatever
number is in front of the x and so in
this case it's a 2 and so our new period
is going to be 180. why do i need to
know that because when you're choosing
the step on your calculator well we know
that step is always 180 over 4. that'll
always be the scenario
and so the step on this
graph is going to be 45 degrees if you
kept it at 90 you're going to struggle
on the calculator because you're going
to have two little values and your
graphs just not going to have the shape
that it's supposed to have so let's go
ahead we'll make our step equal to 45
and there we have our values okay so i'm
going to tabulate those values quickly
and then we'll draw the graph and so
there we have our table with all our
values and now we can draw our graph i'm
going to now plot all the points
and so there we have it
so
quite an interesting graph so what i
want to show you quickly is a normal sun
graph i'm just going to draw it between
0 and 360.
and so there we can see that
that pink graph has completed one cycle
between 360 degrees whereas the green
graph has completed so up to up to
this point over here is one cycle and up
to there's another cycle so it completes
two cycles in 360 degrees and so always
remember that x's are complicated and so
when you say 2x it actually has the
effect of halving okay so every single
coordinate halved okay so if question b
it says what does the 2x do to the graph
it halves the graph what compresses it
in the horizontal direction
then it says determine the amplitude so
amplitude is always the maximum distance
from your resting position
and so the resting position is this
equilibrium line over here the the
x-axis and so that maximum distance well
that's one so your amplitude is one the
range well that's your y values and so
we see the lowest value is minus one and
the highest value is one and so we can
say that y is an element going between
minus one and one
the domain well domain is the x values
and that's what they gave us so that's
from minus 180 up to 360.
as with the tan graph or with the time
graph we would have had to
have excluded the asymptotes but in this
one there are no asymptotes
and then the period now here's where
things are a little bit interesting we
know that a normal period is 360 for a
sin and cos but when you have a sin 2x
well you've halved everything and so
this graph would now compete not compete
complete every
180 degrees and we can see that it
completes one cycle between here so this
point here and this point here that is
one cycle and look how long it took
180 degrees thank you for watching
5.0 / 5 (0 votes)