Failure Fatigue and Creep
Summary
TLDRThis script discusses mechanical failures due to fatigue and creep in engineering materials. Fatigue, responsible for 90% of mechanical part failures, is a sudden failure under fluctuating stress, often initiated from surface defects. Creep is the continuous deformation at elevated temperatures under constant stress, progressing through primary, secondary, and tertiary stages. The lecture includes examples of fatigue testing, the significance of stress amplitude and mean stress, and the use of Larson-Miller parameters for estimating rupture times at different temperatures. It emphasizes the importance of understanding these phenomena for predicting material performance and preventing failures.
Takeaways
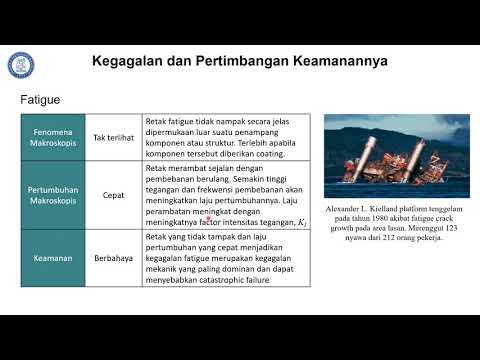
- 🔩 Fatigue is a type of failure caused by fluctuating stress on structures, such as a bridge with cars driving over it, and can lead to sudden failure without warning.
- 📉 Fatigue can occur even when the maximum stress experienced by a part is less than its yield stress, and it's responsible for about 90% of mechanical engineering failures.
- 🔍 A study by Sherry Labs showed that improperly installed bolts on a mining truck led to sudden wheel detachment, illustrating the real-world consequences of fatigue.
- 🛠️ Fatigue testing machines simulate the dynamic stress on parts to predict their performance and lifespan under cyclic stress conditions.
- 📊 Fatigue behavior is often plotted on a graph with stress amplitude on the y-axis and the number of cycles to failure on the x-axis, showing different behaviors for steels and non-ferrous alloys.
- 🛑 For many steels, there's a 'safe' stress level below which parts won't fail due to fatigue, while non-ferrous alloys often have no fatigue limit and require a specified fatigue strength.
- 🔬 Fractography of failed parts can reveal brittle fracture surfaces and 'beachmarks', which are indicative of fatigue failure and provide insight into the failure process.
- 🛡️ Surface treatments like shot peening and material modifications can enhance a part's resistance to fatigue by reducing stress concentrators and improving surface strength.
- 📈 Creep is the deformation of materials under constant load and elevated temperature, occurring in three stages: primary, secondary, and tertiary creep, with secondary being the most critical for long-term performance.
- ⏱️ The Larson-Miller parameter is a useful tool for estimating rupture times at different temperatures and stresses, allowing for faster testing and extrapolation to service conditions.
Q & A
What is fatigue in the context of mechanical engineering?
-Fatigue is a form of failure that occurs in structures subjected to dynamic and fluctuating stress. It can lead to part failure even if the maximum stress is much less than the yield stress measured in tensile testing.
Why is fatigue failure particularly dangerous?
-Fatigue failure is dangerous because it can occur suddenly and without warning, similar to a brittle fracture. The fracture surface, when examined, often appears brittle, which can be deceiving about the nature of the failure.
What role does the installation of parts play in fatigue failure?
-The installation of parts plays a significant role in fatigue failure. Incorrect installation, as seen in the case of the mining truck wheel studs, can lead to premature failure even when the parts themselves are suitable for the service they are put to.
How can fatigue be simulated to test a part's performance?
-Fatigue can be simulated using specialized testing apparatuses that flex the part back and forth, rotating it through multiple directions and subjecting it to sinusoidal stress cycles. The stress parameters such as mean stress, stress amplitude, and frequency can be adjusted to simulate real-world conditions.
What are the two common types of fatigue behavior seen in materials?
-The two common types of fatigue behavior are one seen in many steels, where there is a safe stress level below which the part will not fail, and the other seen in non-ferrous alloys, where there is no fatigue limit and the material will eventually fail given enough cycles.
How is fatigue life defined in materials science?
-Fatigue life is defined as the number of cycles it takes to cause failure at a specified stress level. It helps predict how long a part will last before needing replacement under cyclic stress.
What are the three stages of fatigue failure?
-The three stages of fatigue failure are: 1) crack initiation, where a crack forms at a surface defect, 2) crack propagation, where the crack advances incrementally with each stress cycle, and 3) final failure, which occurs suddenly when the crack reaches a critical size.
What is creep, and how does it differ from fatigue?
-Creep is the deformation of a material under constant stress and temperature over time, often occurring in load-bearing parts at elevated temperatures. It differs from fatigue in that it involves continuous deformation rather than cyclic stress leading to sudden failure.
What are the three stages of creep?
-The three stages of creep are: 1) primary creep, with an initial instantaneous deformation followed by decreasing strain rate, 2) secondary creep, where the strain rate reaches a steady state, and 3) tertiary creep, where the strain rate increases leading to rupture.
How can the Larson-Miller parameter be used to estimate rupture times?
-The Larson-Miller parameter is used to estimate rupture times by plotting it against stress on a graph. By determining the parameter at a high temperature and then extrapolating to the service temperature, one can estimate the time to rupture at that temperature.
Outlines

Cette section est réservée aux utilisateurs payants. Améliorez votre compte pour accéder à cette section.
Améliorer maintenantMindmap

Cette section est réservée aux utilisateurs payants. Améliorez votre compte pour accéder à cette section.
Améliorer maintenantKeywords

Cette section est réservée aux utilisateurs payants. Améliorez votre compte pour accéder à cette section.
Améliorer maintenantHighlights

Cette section est réservée aux utilisateurs payants. Améliorez votre compte pour accéder à cette section.
Améliorer maintenantTranscripts

Cette section est réservée aux utilisateurs payants. Améliorez votre compte pour accéder à cette section.
Améliorer maintenantVoir Plus de Vidéos Connexes

Reaching Breaking Point: Materials, Stresses, & Toughness: Crash Course Engineering #18
Analisis Kegagalan Logam: Modul 1 Segmen 4 (Pertimbangan Keamanan dari Kegagalan)

Mechanics of Materials: Lesson 16 - Fatigue and Creep Failures with S-N Diagram
Group 12, Mechanics of Fracture and Failure in High Entropy Materials

Understanding Fatigue Failure and S-N Curves

Bahan-bahan Teknik dan Sifat-sifat Mekanik Bahan - Teknologi Mekanik
5.0 / 5 (0 votes)
