BCG Matrix (Growth Market Share Matrix) | Hindi

Sahil Khanna
21 Aug 201705:34

Summary

TLDRThe video script by Sahil Khanna from Intellectual Indies explains the BCG Matrix, a tool for evaluating a company's product lines based on market share and growth rate. It categorizes products into Stars, Question Marks, Cash Cows, and Dogs, guiding businesses on investment strategies. Stars, with high growth and market share, are profitable but costly, while Cash Cows offer steady returns with low growth. Question Marks have potential but are uncertain. Dogs lack both growth and market share and are typically not worth investing in. The matrix helps in strategic planning to maximize profits and avoid unproductive investments.

Takeaways

  • 🔔 Subscribe to Intellectual Indies and press the bell icon to never miss an update.
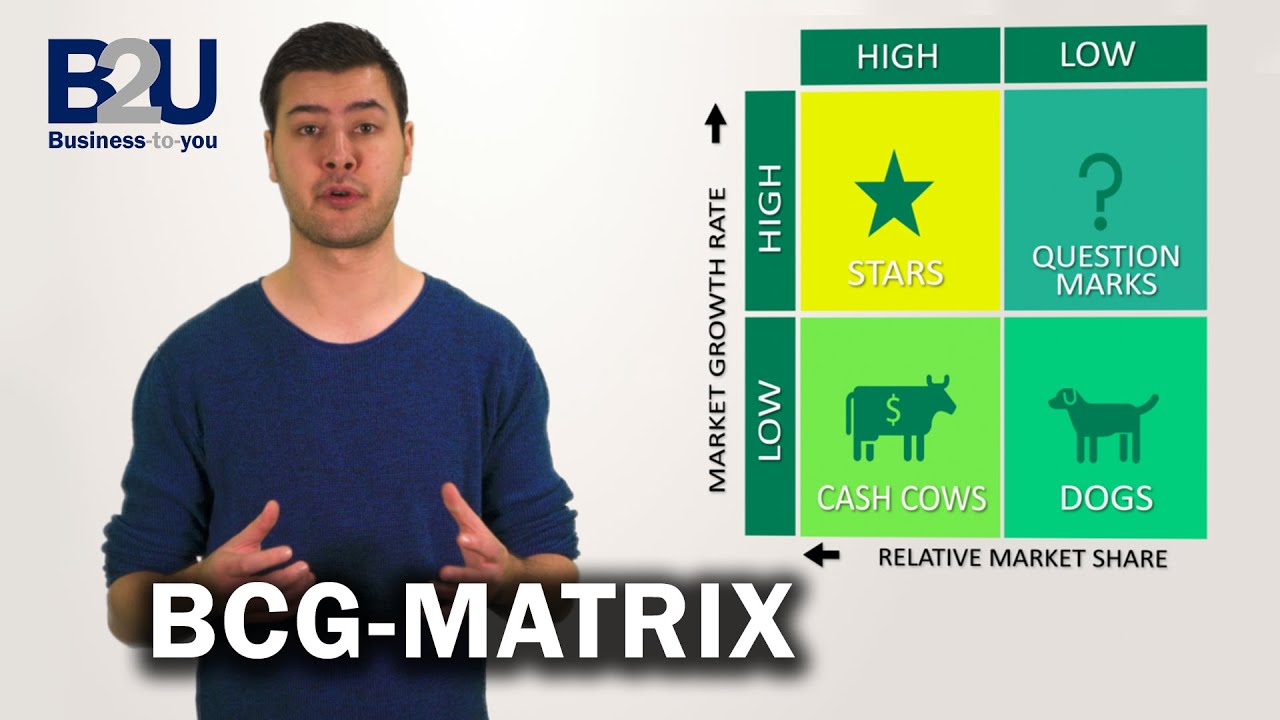
  • 📊 The BCG Matrix helps identify and categorize product lines based on market share and growth rate.
  • ⭐ High market share and high growth rate products are called Stars, which are profitable but also require high investment.
  • ❓ Products with low market share but high growth rate are called Question Marks, as their future performance is uncertain.
  • 💵 Cash Cows have high market share but low growth rate, providing steady income with minimal investment needed.
  • 🐶 Products with low market share and low growth rate are termed Dogs, and it's generally advised not to invest in them.
  • 💸 Investing in Stars can be beneficial, but it comes with high expenses.
  • 📈 Cash Cows generate revenue that can be reinvested into other products.
  • 📉 Dogs are often in the declining phase of the product life cycle and are not worth further investment.
  • 🔄 Question Marks have the potential to become Stars with increased investment and growth.
  • 📦 The BCG Matrix is different from the product life cycle as it considers all product lines together, not just one product.
  • 🚀 New products start as Question Marks and may transition to Stars if they perform well in the market.

Q & A

  • What is the BCG matrix and what does it represent?

    -The BCG matrix, also known as the Boston Consulting Group matrix, is a tool for portfolio analysis and planning that helps businesses to understand the market position of their product lines. It represents a graph of growth rate and market share, categorizing products into Stars, Question Marks, Cash Cows, and Dogs.

  • What are the four categories of products in the BCG matrix?

    -The four categories are Stars, which have high market share and growth rate; Question Marks, which have low market share but high growth rate; Cash Cows, which have high market share but low growth rate; and Dogs, which have low market share and low growth rate.

  • Why are products with high growth rate and low market share called Question Marks?

    -Products are called Question Marks because their future performance is uncertain. They have high potential for growth but are not yet well-established in the market, hence the need for further investment and observation.

  • What does the term 'Cash Cow' imply in the context of the BCG matrix?

    -In the BCG matrix, 'Cash Cow' refers to products that have a high market share but are in a slow or stagnant growth phase. These products generate steady cash flow that can be reinvested in other areas of the business.

  • How does a company decide whether to invest in a product that falls under the Dog category?

    -According to the script, products in the Dog category should generally not be invested in because they have low market share and growth rate, indicating a lack of interest from consumers. It's better to remove such products from the product line.

  • What is the ultimate goal of a company in terms of its product lines according to the BCG matrix?

    -The ultimate goal is to have as many products as possible in the Star category, as these products are both profitable and have high growth potential, although they may require high expenses.

  • How can a company identify which product line should be invested in or not, using the BCG matrix?

    -The BCG matrix helps identify the position of each product line and suggests whether to invest in it based on its market share and growth rate. Products in the Star and Question Mark categories may require investment to grow, while Cash Cows can provide funds for reinvestment.

  • What is the potential trajectory of a product categorized as a Question Mark in the BCG matrix?

    -A product in the Question Mark category has the potential to move to the Star category if it receives the necessary investment and successfully increases its market share while maintaining high growth rate.

  • How does the BCG matrix differ from the product life cycle?

    -The BCG matrix focuses on the entire product line and their market positions in terms of growth rate and market share, while the product life cycle looks at the stages of a single product's life from introduction to decline.

  • What advice does the speaker give regarding products in the Dog category, specifically in the context of the Indian market?

    -The speaker suggests avoiding products in the Dog category for the Indian market, as there is no niche market large enough to justify the investment in such products, which typically have low market share and growth rate.

  • What is the speaker's final recommendation for viewers who have doubts about the BCG matrix?

    -The speaker encourages viewers with doubts to ask questions in the comments section of the video, and also invites them to like, share, and engage with the content.

Outlines

00:00

📈 Understanding the BCG Matrix

This paragraph introduces the BCG Matrix, a tool used to evaluate a company's product lines based on their market share and growth rate. It explains the four quadrants of the matrix: Stars (high market share, high growth rate), Question Marks (low market share, high growth rate), Cash Cows (high market share, low growth rate), and Dogs (low market share, low growth rate). The speaker, Sahil Khanna, uses examples like Apple's product lines to illustrate how the matrix can help businesses decide which products to invest in and which to potentially eliminate. The emphasis is on moving products towards the Star category for maximum profitability, while leveraging Cash Cows for investment in other areas.

05:01

🌐 Conclusion and Call to Action

In the concluding paragraph, Sahil Khanna wraps up the discussion on the BCG Matrix, emphasizing the importance of strategic product management. He encourages viewers to ask questions in the comments if they have any doubts, and to like and share the video if they found it helpful. The speaker also humorously addresses the potential niche market in India, suggesting that focusing on a product in the Dog category might not be the best strategy due to limited demand. The video ends with a friendly farewell, acknowledging that viewers might be watching at any time of the day.

Mindmap

Keywords

💡BCG Matrix

The BCG Matrix, also known as the Boston Consulting Group Matrix, is a business and marketing strategy tool that helps companies evaluate the performance of their business units or product lines. It is defined by two axes: market growth rate and relative market share. In the video, the BCG Matrix is used to categorize products into Stars, Question Marks, Cash Cows, and Dogs, each with different strategic implications for the company.

💡Product Line

A product line refers to a group of related products that are offered by a single company. For instance, Apple has different product lines including the iPhone, iMac, and iPod. In the context of the video, understanding product lines is crucial for applying the BCG Matrix to identify the strategic position of each line within the market.

💡Market Share

Market share is the portion of the total market that a company or a product line occupies. It is a key factor in the BCG Matrix, determining whether a product is a 'Cash Cow' with high market share but low growth rate, or a 'Dog' with low market share and low growth rate. The video explains how market share influences the strategic decisions a company can make.

💡Growth Rate

Growth rate in the context of the BCG Matrix refers to the rate at which a market or a product line is expanding. A high growth rate can indicate a 'Star' product with high potential, while a low growth rate might suggest a 'Cash Cow' or a 'Dog'. The video script discusses how growth rate affects the categorization and strategy of a product line.

💡Star

In the BCG Matrix, a 'Star' is a product that has both a high market share and a high growth rate. The video describes Stars as products that are both profitable and costly to maintain due to their high expenses, and they are seen as a potential source of future cash cows.

💡Question Mark

A 'Question Mark' in the BCG Matrix is a product with a low market share but a high growth rate. The term is used in the video to describe products whose future performance is uncertain, and it is suggested that investment in these products could potentially shift them into the 'Star' category.

💡Cash Cow

A 'Cash Cow' is a product that has a high market share but a low growth rate. As explained in the video, these products generate significant revenue with relatively low investment, and the profits can be used to invest in other product lines with higher growth potential.

💡Dog

In the BCG Matrix, a 'Dog' is a product with both a low market share and a low growth rate. The video suggests that these products are not beneficial for the business and should be considered for removal or restructuring due to their lack of market appeal and growth potential.

💡Investment

Investment, in the context of the BCG Matrix, refers to the allocation of resources into product lines with the aim of increasing their market share or growth rate. The video discusses how investment decisions are influenced by a product's current position in the matrix, with a focus on moving products towards becoming Stars or maintaining Cash Cows.

💡Product Life Cycle

The Product Life Cycle is a concept that describes the stages a product goes through, from introduction to growth, maturity, and decline. In the video, the script contrasts the BCG Matrix with the Product Life Cycle, noting that while the latter focuses on individual products, the former considers entire product lines.

💡Niche Market

A niche market is a subset of the market that has very specific needs or interests, which may not be served by mass-market products. The video script mentions niche markets in the context of discussing why keeping a product in the 'Dog' category might not be beneficial, especially if the target audience is too small to justify the investment.

Highlights

Subscribe to Intellectual Indies, press the bell icon and never miss any update.

A company can have more than one product line, such as Apple with iPhone, iMac, and iPod.

BCG Matrix helps identify your product lines and what you should do with them.

BCG Matrix is a graph of growth rate and market share, helping understand a product's growth rate and market penetration.

Products with high market share and high growth rate are called 'Stars'.

Products with low market share but high growth rate are called 'Question Marks' because their future is uncertain.

Products with high market share but low growth rate are called 'Cash Cows', as they generate steady revenue.

Products with low market share and low growth rate are called 'Dogs', indicating poor performance for the business.

Increasing growth rate involves high expenses, while high market share brings in more money.

'Stars' have high profit and high expenses, with a potentially high profit margin.

'Cash Cows' generate money that can be invested elsewhere, as their market share is high but growth rate is low.

The ultimate goal is to keep product lines in the 'Star' category, despite higher expenses.

BCG Matrix helps identify which product lines to invest in or discontinue.

Products in the 'Dog' category should be removed as they lack growth and market share.

Introduction phase products are in 'Question Mark', which can potentially shift to 'Star' with investment.

Products in the maturity phase are considered 'Cash Cows', while declining phase products fall into the 'Dog' category.

Maintaining some products in 'Cash Cow' and 'Star' categories is beneficial, but avoid keeping any in 'Dog'.

Targeting a niche market with 'Dog' products is not advisable as it is not viable in India.

Video concludes with a call to like, share, and comment for any doubts.

Transcripts

play00:00

Subscribe Intellectual Indies, press the bell icon and never miss any update.

play00:03

Let's say a company has

play00:05

more than one product line.

play00:08

Product line means apple has iphone

play00:11

Imac, ipod and many items

play00:14

So these different lines are called product lines. So BCG matric tells you

play00:21

you the way to identify your product lines.

play00:25

and what you should do with them?

play00:27

keep watching this video

play00:30

Hello friends, my name is Sahil khanna and you are watching Intellectual indies

play00:37

Basically BCG matrix is a graph of growth rate

play00:40

and market share

play00:43

Here we understand

play00:46

Our product's growth rate and how much it has penetrated the market

play00:51

play00:52

Like you can see in this photo

play00:55

The one whose market share and growth rate is high is called

play00:58

Star

play01:00

The one whose market share is low but growth rate is high is called question mark

play01:03

Because we don't know about it.

play01:06

And how it's going to behave in the future.

play01:09

Whose market share is high but growth rate is low is called cash cows.

play01:12

Because it is still

play01:15

Whose market share and growth rate is low is called DOG

play01:20

Means that thing is not good for you business.

play01:24

Let's understand this thing

play01:27

If i want to increase my growth rate

play01:30

Then i'll spend money.

play01:32

The one who has high growth rate

play01:34

Means high expenses.

play01:36

The one who has high market share

play01:39

More money will come.

play01:42

let's talk about star means both factors are high

play01:45

Both profit and expenses.

play01:54

And here your profit margin can be high too

play01:59

But here if we talk about cash cow

play02:02

cash cow means it's market share is high but it's growth rate is low.

play02:06

Slow or stagnant

play02:09

It means you can take money from here.

play02:11

and can invest somewhere else.

play02:14

basically cash cows of company

play02:17

Helps in investing

play02:21

Like a star

play02:23

It's market share and growth rate is on top

play02:25

Company's ultimate goal is to keep it's product line in star

play02:29

But more star means more expenses.

play02:32

So BCG matrix tells you

play02:35

Which products should be at which category.

play02:38

BCG helps you in identifying

play02:41

Which product line

play02:44

stands at which position and whether you should spend on it or not

play02:48

let's say

play02:50

If your product is in cash cow

play02:53

and you are receiving a lot of money .

play02:56

Let's say your product belongs to dog category then

play02:59

It means no growth rate and market share.

play03:02

and there should you invest or not?

play03:05

No because without market share

play03:07

People are not interested in buying your product.

play03:10

What will you do after spending money on it?

play03:13

Remove the products in dog category

play03:17

What we talked about in product life cycle.

play03:20

The declining phase products comes under dog.

play03:23

ANd product with maturity comes under cash cow.

play03:26

And with growth rate are star.

play03:28

play03:30

Means there money is coming.

play03:32

Now introduction will come in question mark.

play03:36

People don't know about your product

play03:39

So here when you spend money on it.

play03:41

your growth rate will increase.

play03:44

But now your market share is low.

play03:47

That's this one is in question mark.

play03:50

Maybe you shift from question mark to star

play03:53

Directly shift is not possible.

play03:56

But generally it has seen that

play03:59

One in question mark has the potential to enter star.

play04:01

Just like iphone 8 is coming

play04:04

The way they are portraying it, right now it is in question mark

play04:08

Right after it's launch, it'll be shifted towards stars.

play04:10

Becuase everyone is going to buy it.

play04:13

This was everything about BCG matrix.

play04:16

How it is different from product life cycle.

play04:19

Where we talked about only one product.

play04:22

In BCG matrix,we talk about all the product line.

play04:25

Where a product lies.

play04:27

you need to focus

play04:30

So that your product stays in star

play04:32

And some products in cash cow.

play04:36

Some products are not launched yet

play04:39

They'll be in question mark

play04:42

But do not keep any product in dog category.

play04:45

Some people will say keep a product in dog because you are targeting a specific niche.

play04:48

But according to me, say no to dog ;p

play04:51

Because it won't be successful in india and there's no niche market who can spend crore on one single product

play04:57

and you are targeting only 10 people.

play05:00

Like vertu, 2 people buy phones and they are satisfied

play05:04

you can not do this in india.

play05:06

play05:09

Okay friends, video ends here. I hope you liked it.

play05:12

If any doubts, do ask me in the comments.

play05:15

Like share if you liked it.

play05:18

Bye Goodnight Goodmorning Goodafternoon whenever you are watching this video.

Rate This

5.0 / 5 (0 votes)

Etiquetas Relacionadas
BCG MatrixProduct LinesMarket ShareGrowth RateBusiness StrategyProfit MarginInvestment DecisionsProduct Life CycleSahil KhannaIntellectual Indies
¿Necesitas un resumen en inglés?