How statistics can be misleading - Mark Liddell
Summary
TLDRLas estadísticas son poderosas, pero pueden esconder información clave que cambia completamente los resultados, como se demuestra en el caso de la paradoja de Simpson. Este fenómeno ocurre cuando los datos agregados ocultan una variable condicional que influye significativamente en los resultados. Un ejemplo muestra que, al analizar a los pacientes en dos hospitales, la apariencia general de mejores tasas de supervivencia puede ser engañosa. También se presenta en estudios como el de los fumadores y no fumadores, y en análisis del sistema de justicia. La lección es que siempre debemos analizar los datos con cuidado y tener en cuenta las variables ocultas para evitar manipulaciones.
Takeaways
- 😀 Las estadísticas son persuasivas y se utilizan para tomar decisiones importantes a nivel individual, organizacional y gubernamental.
- 😀 Sin embargo, los conjuntos de datos pueden ocultar factores importantes que pueden alterar completamente los resultados.
- 😀 Un ejemplo clásico de cómo las estadísticas pueden ser engañosas es la comparación entre dos hospitales, A y B, según sus tasas de supervivencia.
- 😀 Al dividir los pacientes por su estado de salud, los datos muestran que el Hospital B es, de hecho, una mejor opción para los pacientes con mala salud, a pesar de que Hospital A tenía mejores resultados globales.
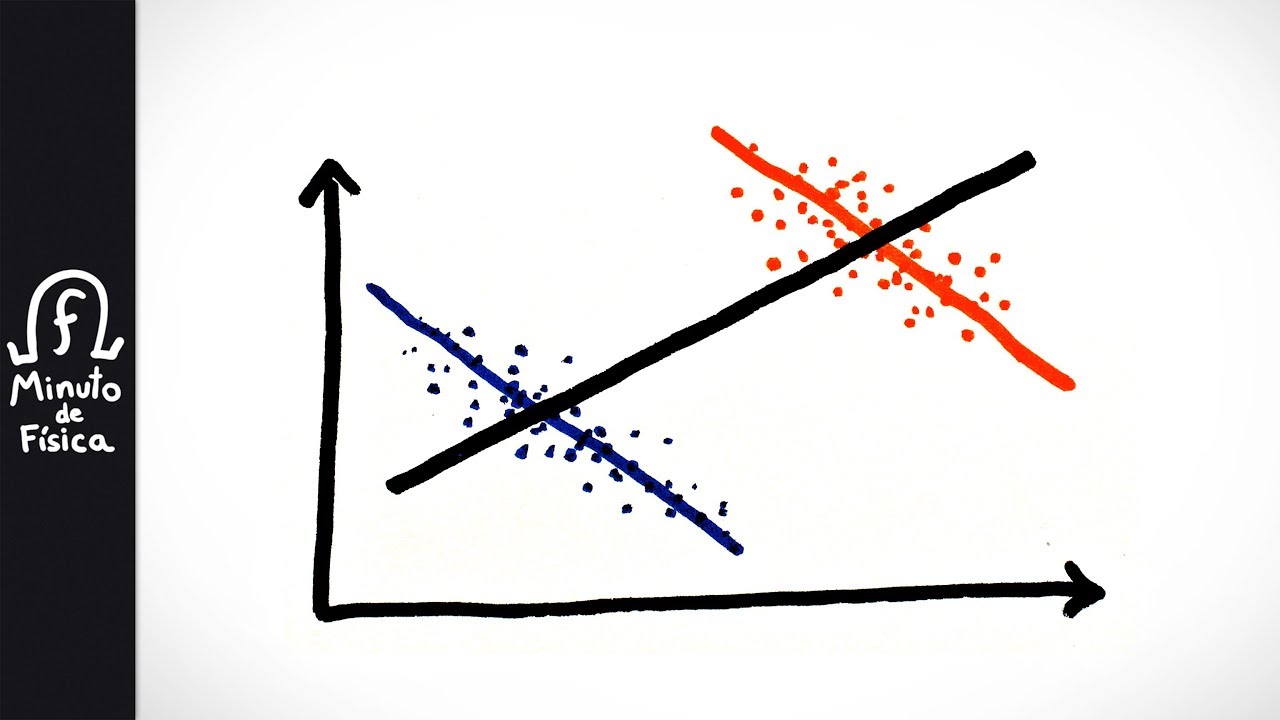
- 😀 El fenómeno que causa esta discrepancia es conocido como la paradoja de Simpson, en la que los datos agregados ocultan variables condicionadas importantes.
- 😀 En la paradoja de Simpson, una variable oculta, como la salud de los pacientes al llegar al hospital, puede influir significativamente en los resultados.
- 😀 La paradoja de Simpson no es solo un escenario hipotético, sino que ocurre en situaciones reales, como en estudios que analizan la tasa de supervivencia de los fumadores y no fumadores.
- 😀 Un estudio en el Reino Unido mostró inicialmente que los fumadores tenían una tasa de supervivencia más alta, pero al dividir por grupos de edad, se descubrió que los no fumadores eran significativamente mayores.
- 😀 Otro ejemplo de la paradoja de Simpson ocurrió en un análisis de los casos de pena de muerte en Florida, donde no parecía haber disparidad racial hasta que se dividieron los casos según la raza de la víctima.
- 😀 Para evitar caer en la paradoja, es esencial examinar cuidadosamente las situaciones subyacentes de los datos y considerar si existen variables ocultas que puedan alterar la interpretación de los resultados.
Q & A
¿Qué es el paradoja de Simpson y cómo afecta los resultados de las estadísticas?
-La paradoja de Simpson ocurre cuando un conjunto de datos puede mostrar tendencias opuestas dependiendo de cómo se agrupan. Esto sucede cuando una variable condicional, como una variable oculta, influye en los resultados. En el ejemplo de los hospitales, los datos agregados ocultaron el impacto del estado de salud de los pacientes, lo que llevó a una interpretación errónea de los resultados.
¿Por qué los datos agregados pueden ser engañosos?
-Los datos agregados pueden ser engañosos porque no tienen en cuenta factores importantes como las condiciones previas de los pacientes o cualquier variable oculta que pueda afectar los resultados. Al no dividir los datos adecuadamente, se puede llegar a conclusiones incorrectas.
¿Cómo afectó el estado de salud de los pacientes a la comparación entre los hospitales A y B?
-El estado de salud de los pacientes influyó en gran medida en los resultados de supervivencia. El hospital A tenía una mejor tasa de supervivencia global, pero al dividir los pacientes entre aquellos en buen y mal estado de salud, se reveló que el hospital B tenía mejores tasas de supervivencia tanto para los pacientes sanos como para los enfermos.
¿Qué papel juega una variable oculta en la interpretación de los datos?
-Una variable oculta es un factor no considerado que puede afectar significativamente los resultados. En el caso de los hospitales, la variable oculta era la proporción de pacientes en buen o mal estado de salud, lo que alteró las conclusiones si solo se miraban los datos agregados.
¿Cuál fue el resultado del estudio en el Reino Unido sobre la supervivencia de fumadores y no fumadores?
-El estudio inicialmente parecía mostrar que los fumadores tenían una tasa de supervivencia más alta que los no fumadores, pero al dividir los participantes por grupo de edad, se descubrió que los no fumadores eran significativamente mayores y, por lo tanto, más propensos a morir debido a su mayor esperanza de vida.
¿Por qué los datos agregados mostraron que los fumadores sobrevivían más que los no fumadores?
-Esto se debió a que los no fumadores en el estudio eran en su mayoría mayores, lo que hacía que tuvieran una esperanza de vida más corta. La edad, por lo tanto, fue una variable oculta que influenció el resultado, y no el hábito de fumar.
¿Cómo se relaciona el análisis de casos de pena de muerte en Florida con la paradoja de Simpson?
-El análisis de la pena de muerte en Florida parecía mostrar que no había disparidad racial en las sentencias, pero al dividir los casos según el raza de la víctima, se reveló que los acusados negros tenían más probabilidades de ser sentenciados a muerte, especialmente si la víctima era blanca.
¿Qué problema se observó en los casos de pena de muerte en Florida al no considerar la raza de la víctima?
-El problema fue que, aunque los acusados blancos fueron sentenciados a muerte con una tasa ligeramente mayor, la diferencia se debía a que los casos con víctimas blancas tendían a recibir una pena más severa, y muchos asesinatos ocurrían entre personas de la misma raza.
¿Cuál es la lección que se debe aprender al interpretar estadísticas?
-La lección principal es que se deben considerar todas las variables relevantes al analizar los datos. No se debe depender únicamente de los números agregados sin tener en cuenta posibles variables ocultas que puedan distorsionar la interpretación.
¿Cómo se puede evitar caer en la trampa de la paradoja de Simpson?
-Para evitar caer en la paradoja de Simpson, es fundamental estudiar los datos en su contexto, dividir los datos de manera lógica y considerar las variables condicionales que puedan influir en los resultados. La interpretación de los datos debe ser cuidadosa y detallada para no ser manipulados por estadísticas mal interpretadas.
Outlines

Esta sección está disponible solo para usuarios con suscripción. Por favor, mejora tu plan para acceder a esta parte.
Mejorar ahoraMindmap

Esta sección está disponible solo para usuarios con suscripción. Por favor, mejora tu plan para acceder a esta parte.
Mejorar ahoraKeywords

Esta sección está disponible solo para usuarios con suscripción. Por favor, mejora tu plan para acceder a esta parte.
Mejorar ahoraHighlights

Esta sección está disponible solo para usuarios con suscripción. Por favor, mejora tu plan para acceder a esta parte.
Mejorar ahoraTranscripts

Esta sección está disponible solo para usuarios con suscripción. Por favor, mejora tu plan para acceder a esta parte.
Mejorar ahoraVer Más Videos Relacionados

¿Pueden los datos llegar a ser contradictorios? - La Paradoja de Simpson
La Paradoja de Simpson

Statistics - Introduction to Statistics

Información asimétrica. Riesgo moral | Cap. 40 - Microeconomía

Tercer paso: estrategias de búsqueda

Galton Board and the Regression to the Mean

Ya no ves el FUTBOL igual por ESTO / BIG DATA
5.0 / 5 (0 votes)