Master Dimensional Modeling Lesson 02 - The 4 Step Process
Summary
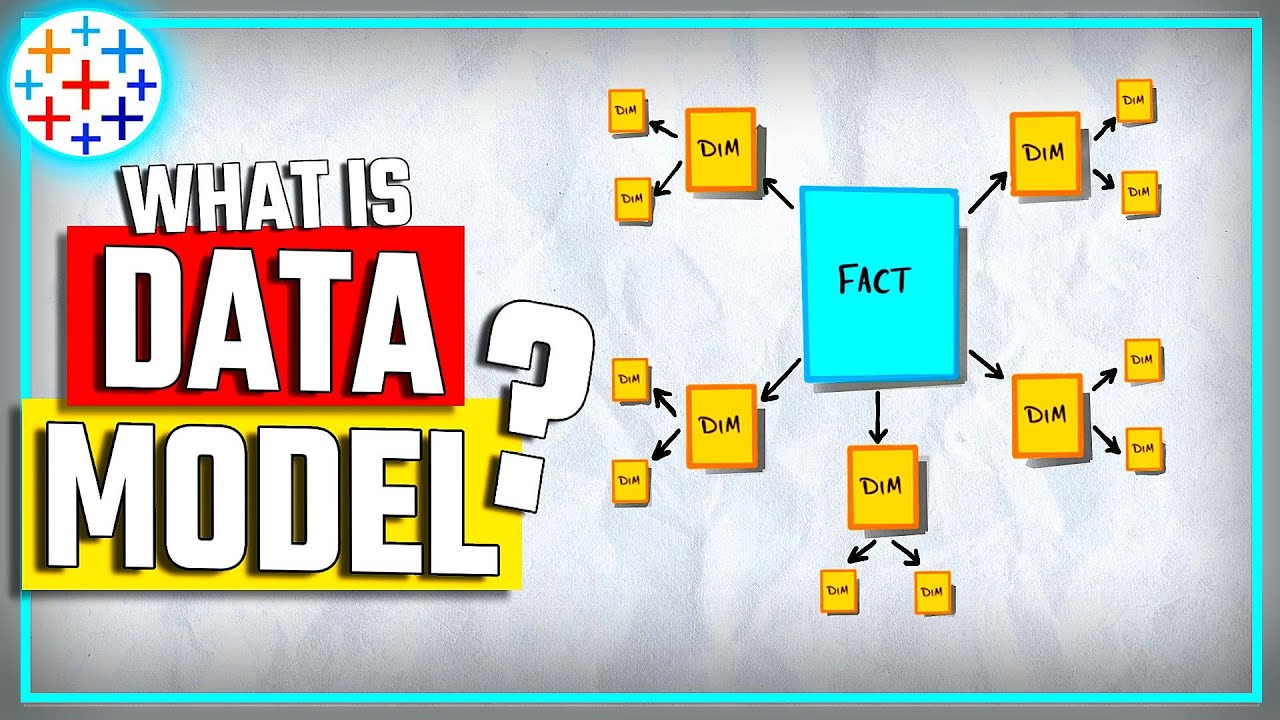
TLDRIn this video, Brian KY provides a step-by-step guide to mastering dimensional modeling, focusing on the process of building a star schema for data warehousing. He outlines four essential steps: selecting the business process (such as sales or inventory), declaring the grain (level of detail), choosing the right dimensions (like time, customer, or store), and identifying facts (quantifiable metrics). The tutorial emphasizes the importance of proper planning to ensure efficient reporting and data storage, warning against practices like snowflaking and encouraging the use of denormalized dimensions to improve usability.
Takeaways
- 😀 Dimensional modeling, also known as the star schema, is a powerful and fun way to organize data for reporting purposes.
- 😀 The first step in dimensional modeling is selecting a business process, like sales, inventory, or purchasing, which are activities that drive the business.
- 😀 It's crucial to identify the data sources early in the process to ensure you have the necessary information for your model and avoid missing key data.
- 😀 The grain is the level of detail in a fact table, and it’s essential to define it upfront to avoid confusion later on. For example, a sales model might track line items, while clickstream data may require a more aggregated approach.
- 😀 Dimensional modeling favors denormalization of data, meaning you should design your dimensions for simplicity and usability, rather than following strict normalization rules.
- 😀 Dimensions provide the context for facts, such as who, what, where, and when, and help filter or group data for reporting.
- 😀 Snowflaking, or creating separate dimension tables that need to be joined together, is a bad practice in dimensional modeling. Always aim for simplicity and clarity.
- 😀 The facts (or measures) in a model represent quantifiable data about an event, like how much was sold or how many units were purchased.
- 😀 Facts should match the declared grain, meaning that every fact in the table should align with the level of detail defined earlier, such as line-item sales or order summaries.
- 😀 Additive facts are preferred for simplicity in reporting, as they can be easily aggregated across different dimensions. Avoid non-additive facts like percentages, which don’t sum neatly.
- 😀 The four essential steps in dimensional modeling are: 1) Select the business process, 2) Declare the grain, 3) Choose the dimensions, and 4) Identify the facts or measures.
Q & A
What is dimensional modeling, and why is it important?
-Dimensional modeling, also known as the star schema, is a method used to organize data for reporting and analysis in data warehouses. It is important because it provides a simplified and effective way to organize data for better business decision-making, making it easier to generate reports and analyze trends.
What are the main steps involved in the dimensional modeling process?
-The main steps are: 1) Select the business process, 2) Declare the grain, 3) Choose the dimensions, and 4) Identify the facts. These steps guide the creation of a star schema, organizing data for analysis and reporting.
What is meant by 'select the business process' in dimensional modeling?
-'Select the business process' refers to identifying a key business activity, like sales or inventory, that drives the business. It is important to focus on processes, not departments, to ensure the modeling supports the organization's needs across multiple areas.
How should you handle data sources when starting dimensional modeling?
-When starting, it is essential to identify the data sources early. These could be relational databases, streaming data, or flat files. By understanding the sources, you can determine the level of detail and attributes needed for reporting, and avoid missing crucial data.
What does 'declaring the grain' mean in dimensional modeling?
-Declaring the grain refers to determining the level of detail for the fact table in the schema. This could be at a very granular level (e.g., individual sales transactions) or a more summarized level (e.g., total sales by day). The grain affects the data's usefulness for reporting and analysis.
What is the difference between facts and dimensions in dimensional modeling?
-Facts are the quantifiable measures of an event, such as sales amount or quantity sold. Dimensions, on the other hand, provide the context for these facts, like the customer, time, or store associated with the event. Dimensions help group and filter the data for analysis.
Why is denormalization important in dimensional modeling?
-Denormalization is important because it simplifies the schema for business users by reducing the need for complex joins. This makes data easier to query and report on. While normalization is important for transactional systems, dimensional modeling favors denormalization for better reporting performance.
What is the issue with snowflaking in dimensional modeling?
-Snowflaking refers to creating multiple normalized tables for a dimension, requiring joins between them. This complicates reporting and reduces query performance. In dimensional modeling, it's recommended to keep dimension tables denormalized to avoid snowflaking and simplify data usage.
What are some examples of facts in dimensional modeling?
-Examples of facts include sales amount, quantity sold, and unit price. These are the measurable quantities that describe the event. Facts can also be non-additive, like profit percentages, but most commonly, they are additive, meaning they can be easily summed across dimensions.
Why is it important to match the fact data to the grain level?
-It's important because mixing different grain levels in the same fact table can cause inconsistencies and incorrect reporting. For example, if a fact table includes both line-item details and order summaries, it will be difficult to aggregate the data correctly. Ensuring the facts match the grain level ensures consistency in reporting and analysis.
Outlines

Esta sección está disponible solo para usuarios con suscripción. Por favor, mejora tu plan para acceder a esta parte.
Mejorar ahoraMindmap

Esta sección está disponible solo para usuarios con suscripción. Por favor, mejora tu plan para acceder a esta parte.
Mejorar ahoraKeywords

Esta sección está disponible solo para usuarios con suscripción. Por favor, mejora tu plan para acceder a esta parte.
Mejorar ahoraHighlights

Esta sección está disponible solo para usuarios con suscripción. Por favor, mejora tu plan para acceder a esta parte.
Mejorar ahoraTranscripts

Esta sección está disponible solo para usuarios con suscripción. Por favor, mejora tu plan para acceder a esta parte.
Mejorar ahoraVer Más Videos Relacionados

Matakuliah Business Intelligence (Materi 4: Dimension Modelling)
Data Modeling Basics | #Tableau Course #32

Part 8 - Data Loading (Azure Synapse Analytics) | End to End Azure Data Engineering Project

How I would learn Data Engineering (if I could start over)

Facts and Dimensions

TUTORIAL BIM REVIT STRUKTUR SMK PART 22 | DPIB SMKN 1 JAKARTA - PLACING KOLOM DAN BALOK
5.0 / 5 (0 votes)
