MACD Revealed: The TRUTH About This Misunderstood Indicator
Summary
TLDRIn this video, Uncle Sam Trading delves into the MACD (Moving Average Convergence Divergence) indicator, uncovering its full potential beyond simple crossovers. Viewers learn how to use MACD for more than just trend following, including spotting reversals in range-bound markets through techniques like divergence and hidden divergence. The video highlights the importance of combining the MACD line, signal line, and histogram for a comprehensive analysis. Additionally, viewers are encouraged to explore advanced trading strategies and premium tools at Uncle Sam Trading, boosting their trading skills and profitability.
Takeaways
- 😀 Don't rely solely on MACD crossovers, as they can be misleading in choppy or sideways markets.
- 📉 The histogram is useful, but not the whole picture—always consider the MACD line and signal line together.
- 💡 MACD is not only for trend-following; it can also be used to identify overbought and oversold conditions in range-bound markets.
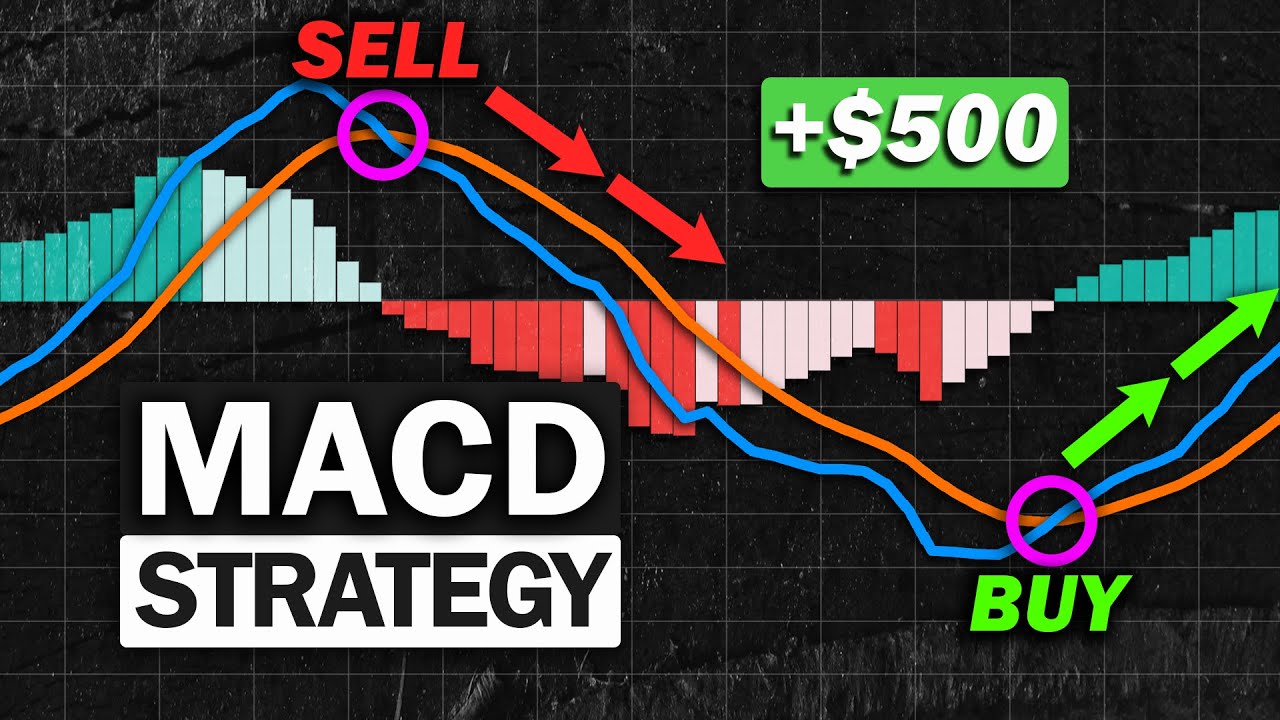
- 🔎 The MACD consists of three main components: the MACD line (blue), the signal line (orange), and the histogram (bar chart).
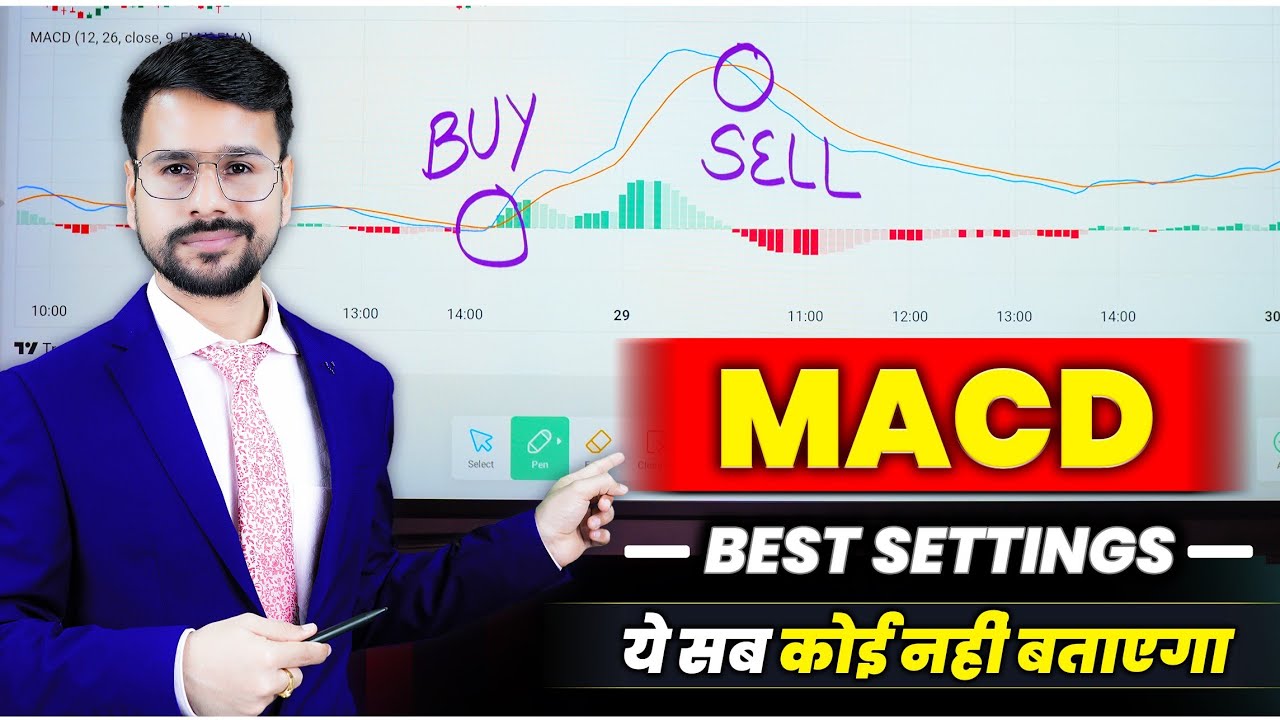
- ⚙️ Standard MACD settings are 12, 26, and 9, but you can adjust them for different sensitivities in market conditions.
- 🔝 When the MACD line is above the signal line, it signals bullish momentum; when it's below, it signals bearish momentum.
- 💥 MACD divergence (when the price and MACD are moving in opposite directions) can be a powerful signal for potential reversals.
- 🚨 Hidden divergence, where price makes higher highs but MACD makes lower highs, signals weakening uptrends.
- 🛠️ Confirm MACD crossovers with other indicators or price action (e.g., breaking through key resistance) to increase reliability.
- 📊 Watch for changes in the histogram: increasing height and upward direction suggest strengthening bullish momentum, while decreasing height and downward direction suggest growing bearish momentum.
Q & A
What does MACD stand for and what is its primary purpose?
-MACD stands for Moving Average Convergence Divergence. It is a momentum oscillator used to analyze price movements, helping traders identify trends and potential reversals.
Why is relying solely on MACD crossovers not recommended?
-Relying solely on MACD crossovers can be misleading, especially in choppy or sideways markets. It may result in false signals, where the price reverses right after a crossover, leading to potential losses.
What is the role of the histogram in MACD analysis?
-The histogram shows the difference between the MACD line and the signal line, providing insight into momentum. While it indicates potential buying or selling pressure, it should not be used in isolation as it may not always align with the MACD line.
How can MACD be used in range-bound markets?
-In range-bound markets, MACD can help identify overbought or oversold conditions. For example, when the MACD reaches extreme levels, it can signal potential buy or sell opportunities, even without a strong trend.
What are the three main components of the MACD?
-The three main components of the MACD are: the MACD line (blue), the signal line (orange), and the histogram (bar chart). These elements work together to help traders analyze momentum and price movements.
How does the MACD line and signal line work together in momentum analysis?
-When the MACD line is above the signal line, it indicates bullish momentum. Conversely, when the MACD line is below the signal line, it suggests bearish momentum. The distance between these two lines shows the strength of the momentum.
What is the significance of divergence in MACD analysis?
-Divergence occurs when price movements and the MACD behave differently. For instance, a bullish divergence happens when the price makes a lower low while the MACD forms a higher low, suggesting weakening selling pressure and a potential reversal.
What is hidden divergence and how does it affect trend analysis?
-Hidden divergence occurs when the price makes a higher high but the MACD forms a lower high. This indicates a weakening uptrend, suggesting the price may soon reverse or lose momentum.
How can MACD crossovers be confirmed with other signals?
-A MACD crossover can be stronger when confirmed by other technical signals. For example, if the MACD crosses above the signal line while the price breaks a key resistance level, it increases the likelihood of a bullish move.
How can traders use the histogram for momentum analysis?
-Traders can observe changes in the histogram's height and direction. An increasing histogram that points upward indicates growing bullish momentum, while a decreasing histogram pointing downward signals bearish momentum taking over.
Outlines

Esta sección está disponible solo para usuarios con suscripción. Por favor, mejora tu plan para acceder a esta parte.
Mejorar ahoraMindmap

Esta sección está disponible solo para usuarios con suscripción. Por favor, mejora tu plan para acceder a esta parte.
Mejorar ahoraKeywords

Esta sección está disponible solo para usuarios con suscripción. Por favor, mejora tu plan para acceder a esta parte.
Mejorar ahoraHighlights

Esta sección está disponible solo para usuarios con suscripción. Por favor, mejora tu plan para acceder a esta parte.
Mejorar ahoraTranscripts

Esta sección está disponible solo para usuarios con suscripción. Por favor, mejora tu plan para acceder a esta parte.
Mejorar ahoraVer Más Videos Relacionados
Most Effective MACD Strategy for Daytrading Crypto, Forex & Stocks (High Winrate Strategy)
NEVER Miss a TREND! MACD Indicator Trading Strategy | MACD Divergence

MACD INDICATOR EXPLAINED (Trade with the trend)
Best MACD Indicator Settings YOU NEED TO KNOW!!!

Mit DIESEM Trading Indikator bist du besser als 99%! (+exakte Anleitung)

La Estrategia De Trading Con MACD Perfecta Para Principiantes
5.0 / 5 (0 votes)
