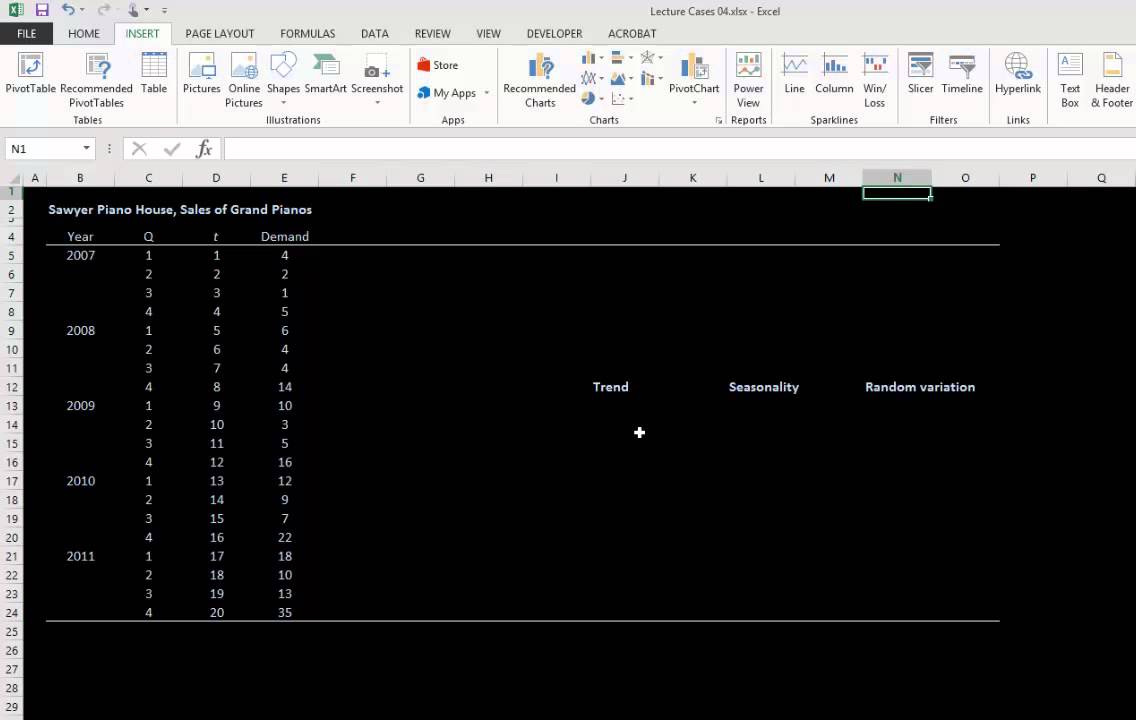
Excel - Time Series Forecasting - Part 2 of 3
Summary
TLDRIn this second part of the Excel time series analysis series, the instructor guides viewers through key steps in extracting and analyzing seasonal and irregular components of time series data. The process involves using a centered moving average to smooth data, dividing the original values by this moving average to isolate the seasonality and irregularity, and averaging seasonal components for accuracy. Viewers learn efficient Excel techniques, including the `AVERAGEIF` function, to speed up calculations. By the end, the data is deseasonalized, setting the stage for more advanced forecasting techniques in the next video.
Takeaways
- 😀 The video is part B of a series on using Excel for time series analysis and forecasting.
- 😀 It's important to watch part A (video 1) first for a better understanding of the concepts covered here.
- 😀 The first step in the process was creating a centered moving average (CMA) for four periods to smooth the time series data.
- 😀 Smoothing the data helps remove the seasonal and irregular components, making it easier to analyze the trend.
- 😀 By dividing the original data (Yₜ) by the centered moving average, we isolate the seasonal and irregular components.
- 😀 The seasonal and irregular components are calculated as a ratio to the smoothed baseline, showing how much each period deviates from it.
- 😀 A value of 1.1 means the seasonal and irregular components are 10% above the baseline, while a value of 0.84 indicates 16% below the baseline.
- 😀 Seasonal components are calculated by averaging the seasonal and irregular components for each quarter across multiple years.
- 😀 The `AVERAGEIF` function in Excel can be used efficiently to calculate the seasonal components instead of manual averaging.
- 😀 The final step in the process is deseasonalizing the data by dividing the original time series (Yₜ) by the seasonal component (Sₜ).
- 😀 The deseasonalized data is crucial for accurate forecasting, as it removes the seasonality and irregularity from the original time series.
Q & A
What is the purpose of the centered moving average (CMA) in this analysis?
-The centered moving average is used to smooth the time series data by removing the seasonal and irregular components. This helps to reveal the underlying trend more clearly.
How does the process of smoothing the time series help in analyzing the data?
-Smoothing the time series helps to eliminate the fluctuations caused by seasonality and irregularity, which allows for better identification of the underlying trend in the data.
What are the seasonal and irregular components in a time series?
-The seasonal component represents regular patterns or cycles that repeat over time, while the irregular component refers to random fluctuations or noise that do not follow any predictable pattern.
How is the seasonal and irregularity component extracted from the time series data?
-The seasonal and irregularity components are extracted by dividing the original time series data (YT) by the centered moving average (CMA), which isolates these components.
What does a value greater than 1 indicate in the seasonal component calculations?
-A value greater than 1 indicates that the seasonal and irregular components are above the baseline, meaning the data point for that period is higher than expected based on the smoothed trend.
What is the baseline in the context of seasonal component analysis?
-The baseline is the smoothed curve created by the centered moving average. It represents the expected value of the time series without the influence of seasonality and irregularity.
How are the seasonal indices (St) calculated for each quarter?
-Seasonal indices are calculated by averaging the seasonal and irregular components for each quarter over multiple years. This helps to isolate the seasonality by eliminating the irregular components.
Why is the `AVERAGEIF` function used in calculating seasonal components?
-The `AVERAGEIF` function is used to calculate the average of the seasonal and irregular components for each quarter, which makes the calculation more efficient compared to manually averaging each data point.
What is the purpose of the `VLOOKUP` function in the seasonal component calculation?
-The `VLOOKUP` function is used to match each data point in the original time series to its corresponding seasonal index. This ensures that the correct seasonal component is applied to each time period.
What does deseasonalizing the data involve and why is it important?
-Deseasonalizing the data involves dividing the original time series (YT) by the seasonal component (St). This removes the effects of seasonality and irregularity, allowing for a clearer view of the trend, which is essential for accurate forecasting.
Outlines

Esta sección está disponible solo para usuarios con suscripción. Por favor, mejora tu plan para acceder a esta parte.
Mejorar ahoraMindmap

Esta sección está disponible solo para usuarios con suscripción. Por favor, mejora tu plan para acceder a esta parte.
Mejorar ahoraKeywords

Esta sección está disponible solo para usuarios con suscripción. Por favor, mejora tu plan para acceder a esta parte.
Mejorar ahoraHighlights

Esta sección está disponible solo para usuarios con suscripción. Por favor, mejora tu plan para acceder a esta parte.
Mejorar ahoraTranscripts

Esta sección está disponible solo para usuarios con suscripción. Por favor, mejora tu plan para acceder a esta parte.
Mejorar ahoraVer Más Videos Relacionados

Time Series Analysis - 2 | Time Series in R | ARIMA Model Forecasting | Data Science | Simplilearn

BUSINESS FORECASTING MENGGUNAKAN ARIMA #datascience #tutorial #machinelearning

What is Time Series Analysis?

Praktikum Ekonometrika II - Analisis ARIMA di EViews

ARGUMENT ANALYSIS - How to write them well all the time! VCE Success

Decompostion1
5.0 / 5 (0 votes)
