1-Market Mechanics

kapı eşiği
23 Jun 202424:17

Summary

TLDRThis script delves into market structure and order flow, emphasizing the role of speculators and their emotional impact on market dynamics. It outlines how technical analysis is used to identify trading opportunities through price movement and volume. The script also discusses various market participants, including commercial companies and financial institutions, and their influence on currency exchange rates. It explains the concepts of supply and demand and how they drive price changes in a free market. Additionally, it touches on the manipulative aspects of financial markets and the importance of recognizing patterns in price action to make informed trading decisions.

Takeaways

  • 📈 Market structure is used as a framework to understand the order flow of the market.
  • 🌊 The collective behavior of speculators can lead to herd mentality, influencing market movements.
  • 📊 Technical analysis is a tool to identify trading opportunities through the study of price movement and volume.
  • 🏦 Large commercial companies and financial institutions contribute to market order flow through significant transactions.
  • 🔄 Speculators, including retail traders, aim to profit from exchange rate movements, contributing to market dynamics.
  • 💵 Market participants are influenced by human emotions, which drive order flow and price action.
  • 🔄 Price action on charts reflects the patterns formed by the interaction of buyers and sellers.
  • 🌐 Currency exchange rates fluctuate due to supply and demand from various market participants.
  • 💹 The meeting point of buyers and sellers is at the price level, where demand and supply interact to set market prices.
  • 📉 In a free market, price movements should reflect a balance between supply and demand, but financial markets can be manipulated by large players.
  • 📚 Understanding the basics of supply and demand, as well as the mechanics of order flow, is crucial for successful trading.

Q & A

  • What is the role of market structure in guiding order flow?

    -Market structure serves as a mechanical framework that helps understand the order flow of the market by analyzing the interactions between buyers and sellers.

  • How do speculators contribute to market behavior?

    -Speculators, being emotionally charged, often exhibit herd mentality, which influences the order flow and market structure through their collective actions driven by fear, greed, and uncertainty.

  • What is the significance of technical analysis in trading?

    -Technical analysis is a framework used to identify trading opportunities by studying price movement and volume, reflecting the battle between buyers and sellers.

  • How do commercial companies impact the forex market?

    -Commercial companies, such as large corporations needing to exchange currencies for international transactions, influence the forex market by placing significant orders through banks, affecting currency supply and demand.

  • What are the different types of market participants mentioned in the script?

    -The script mentions commercial companies, banks and financial institutions (BFIs), speculators, and retail traders as key market participants.

  • How do emotions affect the market order flow?

    -Emotions such as fear, greed, and uncertainty, when involved with large sums of money, drive the order flow as they influence the behavior of market participants.

  • What is the relationship between currency exchange rates and market speculators?

    -Currency exchange rates fluctuate based on the supply and demand from market speculators, which includes both institutional and private investors.

  • How does the price of a currency pair reflect the interaction of buyers and sellers?

    -The price of a currency pair is determined by the meeting point of buyers and sellers, where they agree on a price, creating demand and supply pressures that influence price movement.

  • What is the concept of a 'perfect free market' in the context of financial markets?

    -In a perfect free market, prices would move smoothly to match demand and supply without manipulation. However, financial markets often experience price manipulation by large players due to the volume they control.

  • How do aggressive and passive orders contribute to order flow?

    -Aggressive orders are executed instantly at the current market price, affecting the market immediately, while passive orders wait for the market price to reach a specified level, contributing to future order flow.

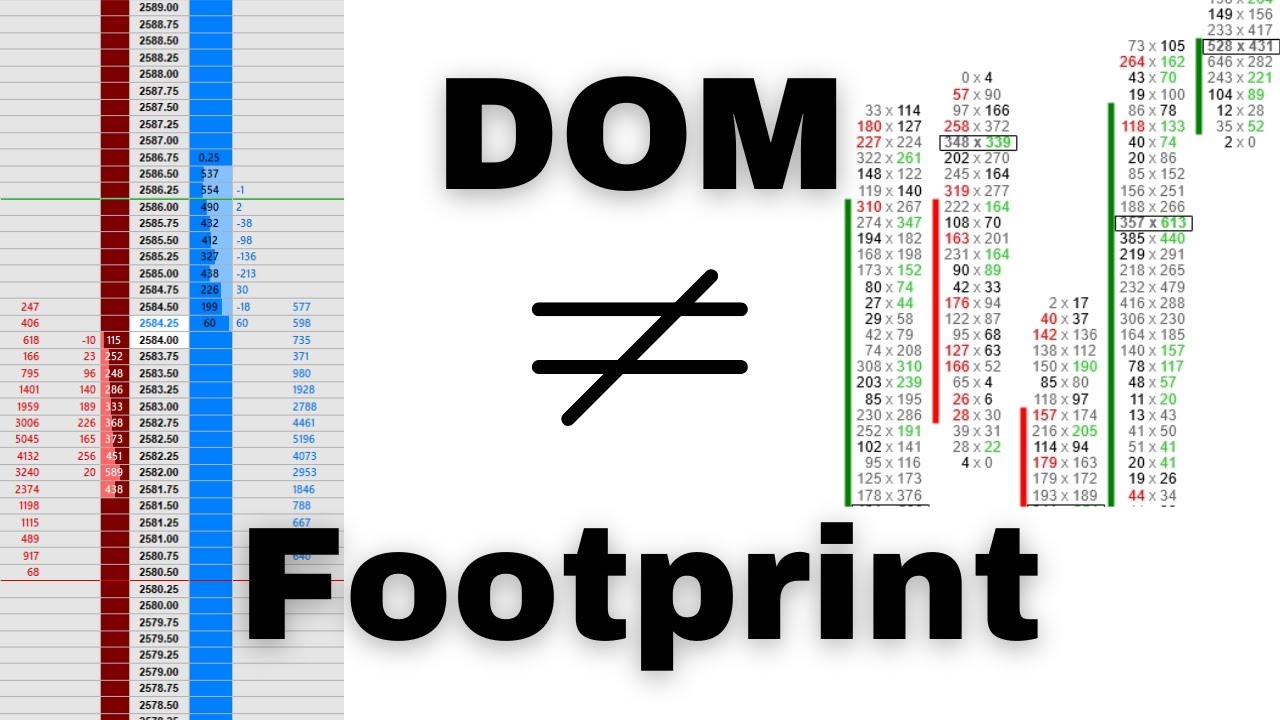
  • What is the purpose of a price ladder in the context of order flow?

    -A price ladder, also known as the depth of market (DOM), visualizes the order book by showing bids and offers at different price levels, indicating the volume of passive orders waiting to be filled.

  • How does the imbalance between supply and demand manifest on a price chart?

    -An imbalance between supply and demand causes rapid price movements to a new equilibrium. On a price chart, this can appear as a breakout from a range or a significant price spike, followed by a return to fill remaining orders.

Outlines

00:00

📈 Understanding Market Mechanics and Emotional Herd Behavior

This paragraph introduces the concept of market structure as a framework for understanding the flow of orders in the market. It emphasizes the role of speculators, who are often driven by emotions like fear, greed, and uncertainty, leading to herd-like behavior. The paragraph also explains how technical analysis is used to identify trading opportunities through the study of price movement and volume, reflecting the battle between buyers and sellers. It mentions various market participants, including commercial companies, banks, financial institutions, and retail traders, all of whom are influenced by human emotions and contribute to the order flow that shapes market prices. The paragraph concludes by discussing how these market dynamics create patterns that can be used for forecasting future price movements.

05:06

📉 The Impact of Supply and Demand on Market Prices

The second paragraph delves into the basic economic principles of supply and demand, using a diagram to illustrate how the quantity of a product demanded by consumers changes with price levels. It explains how a decrease in price typically increases demand, while an increase in price can激励 suppliers to offer more of the product. The paragraph then explores what happens when there is a significant imbalance between supply and demand, causing prices to adjust to reach a new equilibrium. It applies these principles to the forex market, explaining how currency exchange rates are influenced by the actions of various market participants, including institutional and private investors. The paragraph also touches on the idea that financial markets can be manipulated by large players, who can influence price movements through their substantial orders.

10:09

💼 Order Flow and Its Components in the Market

Paragraph three discusses order flow, which is the interaction between passive and aggressive orders in the market. Passive orders, such as limit and stop orders, are pending orders that wait for the market price to reach a specified level. Aggressive orders, on the other hand, are executed immediately at the current market price. The paragraph explains how these orders contribute to the supply and demand dynamics in the market. It also introduces the concept of a price ladder, or depth of market, which visualizes the order book and shows the volume of bids and offers at different price levels. The paragraph uses an example of a company needing to exchange currencies to illustrate how large orders can significantly impact market prices and discusses the strategies that banks might use to manage such orders to avoid negative slippage.

15:12

🌐 The Role of Large Institutions in Shaping Market Prices

This paragraph provides an example of how a large order, such as one from a bank's dealing desk, can affect market prices. It explains that banks may choose to split large orders into smaller parts to avoid significant price slippage and to average out a better price for their clients. The paragraph describes how the immediate execution of a large order can cause a rapid increase in price due to an imbalance between supply and demand. It also discusses how banks might leave the remaining part of an order as a passive order, hoping that the market will return to a certain price level to fill the order. The paragraph concludes by emphasizing the importance of understanding these dynamics for traders looking to time their entries and exits in the market.

20:16

📊 Translating Order Book Theory to Price Charts

The final paragraph explains how the concepts discussed, such as order flow and market imbalances, can be observed on price charts. It suggests that by looking for large imbalances between supply and demand, traders can identify opportunities to enter the market. The paragraph describes how price movements can be analyzed on different time frames to gain a better understanding of market trends and to refine trading strategies. It also mentions that the forex market, being an OTC (over-the-counter) market, does not have a central exchange, making it difficult to view a complete order book. Instead, traders rely on price charts and candlestick patterns to interpret market activity. The paragraph concludes by encouraging traders to look for patterns on price charts that indicate significant shifts in supply and demand, which can signal potential trading opportunities.

Mindmap

Keywords

💡Market Structure

Market Structure refers to the organization and characteristics of a market, which includes the number and types of buyers and sellers, the degree of competition, and the relationships among them. In the video, market structure is used as a framework to understand the order flow of the market, which is the sequence of transactions that occur and the way they influence market prices. It's important for predicting market movements and identifying trading opportunities.

💡Order Flow

Order flow is the cumulative orders from buyers and sellers that drive the market's price action. It's a critical concept in the video because it represents the actual force behind price movements. Understanding order flow helps traders anticipate price changes and make informed trading decisions.

💡Speculators

Speculators are individuals or entities that trade with the expectation of making a profit from price movements, without having an underlying interest in the asset itself. They play a significant role in the video's narrative as their collective emotional behavior can influence market trends and patterns.

💡Technical Analysis

Technical Analysis is a method used to evaluate investments and identify trading opportunities by analyzing statistical trends gathered from trading activity, primarily price movement and volume. It's highlighted in the video as a tool to identify patterns in the market's order flow that can be used to forecast future price movements.

💡Commercial Companies

Commercial Companies are businesses that engage in transactions for their commercial needs. In the context of the video, these companies are mentioned as significant market participants that can influence order flow and market structure through large transactions, such as currency exchanges for international trade.

💡Banks and Financial Institutions (BFI)

Banks and Financial Institutions (BFI) are significant players in the financial markets, facilitating large transactions on behalf of their clients. The video describes how their actions, such as executing large orders, can significantly impact market order flow and prices.

💡Retail Traders

Retail Traders are individual investors who trade for their own account, as opposed to institutional traders who trade on behalf of a company or fund. The video emphasizes that retail traders, like all market participants, are influenced by emotions and contribute to the overall order flow.

💡Human Emotion

Human Emotion is a central theme in the video, as it influences the behavior of market participants, from retail traders to institutional investors. Emotions such as fear, greed, and uncertainty can lead to herd-like behavior and significant shifts in market order flow.

💡Currency Exchange Rates

Currency Exchange Rates are the rates at which one currency can be exchanged for another. The video explains how exchange rates are determined by the supply and demand dynamics in the forex market, influenced by speculators and other market participants.

💡Supply and Demand

Supply and Demand are fundamental economic concepts that describe the relationship between the quantity of a product that producers are willing to supply and the quantity that consumers are willing to purchase at various prices. In the video, these concepts are applied to the forex market to explain how price movements are driven by the interplay between buying and selling pressures.

💡Price Action

Price Action refers to the movement of prices on a price chart, reflecting the cumulative effect of all market orders. The video uses price action as a visual representation of the market's order flow and emphasizes its importance in technical analysis for identifying trading opportunities.

💡Passive and Aggressive Orders

Passive and Aggressive Orders are two types of orders in trading. Passive orders are limit or stop orders that wait for the market to reach a certain price, while aggressive orders are executed immediately at the current market price. The video explains how these orders interact to create order flow and influence price action.

Highlights

Market structure serves as a framework for understanding order flow dynamics.

Speculators often exhibit herd mentality due to emotional involvement in market activities.

Technical analysis is used to identify trading opportunities through the study of price movement and volume.

Commercial companies and financial institutions play significant roles in market order flow.

Human emotions significantly influence the behavior of market participants.

Price action on charts is a result of the interaction between buyers and sellers in the market.

Currency exchange rates are influenced by the supply and demand from market speculators.

The meeting point of buyers and sellers is determined by price, which is influenced by demand and supply.

Financial markets can be manipulated by large players due to the volume they introduce.

Economics 101 provides a basic understanding of how price levels are determined by supply and demand.

The demand for a product increases as its price decreases, attracting more buyers.

Supply increases as the price of a product rises, incentivizing sellers to provide more of the product.

The intersection of supply and demand curves determines the market price.

Imbalances in supply and demand can lead to significant price shifts to reach a new equilibrium.

The forex market operates on the same principles of supply and demand as other markets.

Liquidity in a market allows for smoother price movements, whereas imbalances cause aggressive shifts.

Order flow is the result of the interaction between passive and aggressive orders in the market.

Passive orders wait for the market price to reach them, while aggressive orders execute immediately.

A price ladder visualizes the order book, showing bids, offers, and the volume at each price level.

The forex market, being an OTC market, does not have a central exchange, making it decentralized.

Price charts and candlestick charts provide valuable information on past and current prices and market movements.

Identifying large imbalances between supply and demand is key to understanding market shifts.

Combining market structure with supply and demand analysis refines trading entries and exits.

Transcripts

play00:00

So now we should have a very solid understanding of market structure and how we essentially use

play00:06

market structure as a mechanical framework to guide us through the order flow of the market.

play00:12

But now we are ready to start to look at the actual mechanics of the market as in what is

play00:16

actually behind the production and the interaction of that order flow that then generates the market

play00:23

structure that we have just been spending time analyzing. Now as history has repeatedly shown

play00:29

speculators as an aggregate they are often a very very emotionally charged group. Now when you get

play00:35

millions of them together in a highly emotional money game of fear greed and uncertainty their

play00:42

combined behavior kind of takes on a kind of you know herd mentality. So technical analysis is the

play00:48

framework that we use to identify trading opportunities through the study of price

play00:53

movement and volume from that battle between buyers and sellers that is then reflected on

play00:58

a price chart. So you have big commercial companies you know putting huge orders through the market

play01:03

say the Japanese construction company maybe they need to buy thousands of tons of timber from

play01:09

Canada for example then they're going to need to exchange a large amount of Japanese yen

play01:14

for Canadian dollars in order to make that purchase. So they approach the dealing desks

play01:19

at large banks to facilitate that transaction on their behalf so BFI's banks and financial

play01:25

institutions those are the other big players who are putting you know massive orders through the

play01:29

market for various reasons. Then we also have speculators who are purely trading to try and

play01:35

extract the profit from the movement and exchange rates right and this also includes large financial

play01:40

institutions as well as independent retail traders such as us. Now that is of course not an

play01:47

exhaustive list of market participants just kind of some of the main ones that we can think about.

play01:52

Now all of those are affected by the forces of human emotion that come into play when sums of

play01:58

money are involved and all of this behavior and participation is what drives the order flow that

play02:05

is put through the market. So that interaction of buyers and sellers with that order flow then

play02:10

prints the price action that we actually see on our charts and that price action then creates

play02:15

patterns and it's these patterns that repeat themselves over and over time and time again.

play02:21

You know crowd psychology has been reflected in the prices of stocks indices commodities futures

play02:26

and currencies since the beginning of the free market and that interaction of you know millions

play02:31

of different participants for as many reasons all with their own emotions and agendas that forms

play02:37

price patterns that stretch over extended periods of time and can be used to make high probability

play02:42

forecasts of where price may potentially move in the future. Now currency exchange rates they move

play02:49

up and down as a result of supply and demand from market speculators so every day investors and

play02:55

traders both institutional and private individuals all buy and sell currencies and the numerous

play03:00

types of market participants that we just discussed they are buying or selling for their own unique

play03:05

reasons with their own unique views ideas and beliefs around what the currency pairs they are

play03:09

trading are actually worth. Now the meeting point of those buyers and sellers for whatever reason

play03:16

that they are acting is price so no trades can take place unless both the buyer and the seller

play03:23

actually agree on a price so this drives the price of currency pairs with buyers bringing with them

play03:28

demand for the pair applying that upward pressure on prices while sellers bring supply applying

play03:33

downward pressure on prices and the market runs like a continuous auction throughout the day

play03:38

with buyers and sellers constantly competing with each other to get the best possible price.

play03:44

Now in a perfect kind of free market this would be a pretty smooth and fair process

play03:48

however in the financial markets this can often be quite a heavily manipulated process

play03:54

so let me explain. First we need to have a quick and very very basic lesson on economics 101.

play04:01

So on this diagram on the y-axis on the left hand side we have the price level for the cost of

play04:06

product x right and then down along the bottom on the x-axis we have the quantity of product x

play04:12

that is available to buy from sellers of product x so now what we do is we plot on this line here

play04:18

and this line represents the demand from people for the product so obviously at the start of the

play04:25

curve where price is at its highest the amount of quantity demanded for product x will be near its

play04:31

lowest because not everyone really wants to pay or maybe can afford such an expensive price for

play04:37

product x but as the price falls the demand for it will increase and increase and increase

play04:43

more people will want to buy or will be able to buy the product as it gets cheaper that makes

play04:49

logical sense right of course there are some exceptions you know like designer clothes for

play04:53

example where more people actually desire them the more expensive that they are but generally

play04:58

when something is cheaper more people want and demand it so at the lower price p2 more quantity

play05:05

of the product is demanded at q2 so demand increases as the price falls now let's just

play05:12

remove the demand curve for a second and we'll bring it back in a minute so this line here

play05:18

represents the supply of product x so down at the start of the curve on the bottom left hand corner

play05:23

where price is at its lowest the amount of quantity that is supplied to the market

play05:29

for it will be at its lowest but as the price rises the supply of the product will increase

play05:34

and increase and increase because suppliers so sellers of the product they will then be more

play05:40

heavily incentivized to supply and sell the product because they are going to receive more

play05:44

money right in exchange for actually supplying it so hopefully this also makes logical sense

play05:50

because the higher the price that you can get for selling something generally the more of it you're

play05:54

going to want to sell or you know more people will then enter into the market and they will also start

play06:00

to sell it so the total supply of product x will increase that the higher the price is so supply

play06:08

increases as the price rises but we can't just only have sellers in the market and we can't just

play06:16

only have buyers in the market we need both a buyer who demands the product and a seller who

play06:21

supplies the product because it takes two to make a market so when you plot both the demand curve

play06:27

and you plot both the supply curve over each other you can then see where the market price

play06:32

will be so where buyers and sellers meet is where they agree to exchange money for their goods or

play06:38

service and that determines the market price so that price where the supply meets demand that

play06:44

is the fair market value but what happens if there is a lot of demand for a product

play06:50

what if there is so much demand that the product completely sells out and there are no more sellers

play06:55

left at that price level but people are still demanding it people still want to buy it but

play07:00

there's no one there to sell it to them well the price is going to increase right because there

play07:04

needs to be an incentive for new suppliers to enter the market to fulfill that increase in demand

play07:10

or people you know who still have the product left to sell they're simply just going to increase

play07:14

their prices because they know that they can get away with charging a higher price right

play07:18

because there is so much demand that people will be willing to potentially pay a higher price

play07:23

so what happens is the demand curve shifts up like this so now the price goes up in order to

play07:30

increase the supply of the product to meet that increase in demand for it so if everyone wants

play07:36

to buy a product but nobody wants to sell it at the price p1 then the only way to either fulfill

play07:42

or reduce the demand is to increase the price to p2 so then you'll get the increase in the quantity

play07:48

supplied from q1 to q2 so if the price goes up then the amount of supply will go up and the market

play07:55

reaches a new higher equilibrium price from that increase in demand and this is the new fair market

play08:02

value so the exchange rate in the forex market it works by the exact same principle this mechanism

play08:09

is going on continuously every single second that the market is open and price is constantly moving

play08:14

pip by pip to match the price perfectly between the demand and supply between both buyers and

play08:21

sellers and that is how a free market works now the more liquid a market is the easier that price

play08:27

can slowly you know move slowly and smoothly up and down but when there is an overwhelming

play08:32

imbalance between the supply and demand so when there is a lot more quantity demanded then there

play08:38

are actually sellers supplying it or maybe a lot more sellers supplying the product then there are

play08:43

actually people willing to buy it at the current market price then there is an aggressive change

play08:48

in the price level because either the supply or the demand right it has to shift a significant

play08:54

amount to find the new market equilibrium price so in an ideal situation you know if markets are

play09:00

absolutely perfect this would be quite a natural process where buyers and sellers can freely agree

play09:05

on price however in the financial markets this movement of price is often quite a manipulative

play09:10

process so the big players that we mentioned earlier you know the banks the head funds and

play09:15

any sort of large institution they have the ability to control movements of price to a degree

play09:21

due to the huge amounts of volume that they put out into the market you know using all sorts of

play09:26

tactics to trick traders into potentially taking the other side of their positions

play09:31

in order to utilize them for liquidity now being able to recognize this is going to bring you one

play09:37

step closer to joining them because what have I told you that on the price charts they actually

play09:42

leave footprints and clues indicating their manipulative actions see these institutions

play09:47

they just have no way to actually hide the overwhelming imbalance in the supply demand

play09:52

that they create to cause price to move in their favor because their order flow is just so large

play09:59

because when they put their orders through it creates those huge shifts and imbalances

play10:03

in the supply and demand in the market now every time frame shows the same patterns again and again

play10:08

where you can literally see where this is happening so using all of the time frames together

play10:12

you know it's going to provide a clear picture on where the big players are entering and exiting the

play10:17

markets so that we can time our entries and exit with extreme precision using a mechanical edge

play10:24

but before we look at how we can you see these imbalances being caused between supply and demand

play10:30

by those big players on our price charts first we must understand a little bit more about the

play10:34

mechanics behind that order flow in the market so order flow is the interplay between both passive

play10:42

and aggressive orders in the market in more simple terms it essentially just means the interaction

play10:48

between buyers and sellers so the supply and demand that they bring into the market

play10:53

via their orders right that they are putting through the market now a passive order is an order

play10:58

in which the price is different from the current market bid and ask price so this is typically

play11:03

limit and stop orders so orders which are waiting for price to either come up or come down to them

play11:09

to hit them so kind of a really simple way to think about this is passive orders are essentially

play11:14

just pending orders sitting in the order book waiting to be filled when price eventually reaches

play11:19

them so remember a limit order is one where you buy or sell at a specified price or better

play11:26

below or above the current market price now the other type of passive order is called a stop order

play11:32

and a stop order is where you buy or sell at a specified price or worse above or below the

play11:38

current market price now if you haven't done so already please watch the module on brokers

play11:42

where we discuss the different order types in much more depth so both of those stop and limit

play11:49

orders are classified as passive orders so essentially they're just pending orders that

play11:52

are sitting in the order book waiting to be hit right but the other type of order is called an

play11:57

aggressive order and aggressive orders are when a trader executes the order instantly so that they

play12:02

buy or sell at the current best market ask or bid price so it's generally an at market order

play12:09

so if you just want to instantly buy an instrument right you will get filled at the best current ask

play12:14

price and if you instantly want to sell an instrument then you will get filled at the best

play12:19

current bid price so order flow as a whole it is essentially just the interaction so the interplay

play12:27

between all of these types of orders so you have the passive orders those pending orders that are

play12:31

just sitting there in the order book waiting to be hit and then these passive orders are actually

play12:35

visible in the order book you can see them you know just sitting there but then you have the

play12:39

aggressive orders where traders just step in and instantly hit either the current best bid or ask

play12:45

price so what does that actually look like well something that is commonly used in the markets

play12:52

which trade through a central exchange such as the futures market and most stock markets

play12:58

is a price ladder which essentially visualizes the order book so it's otherwise known as the

play13:03

dom or the depth of market and it shows all of the bids and offers you know those passive orders

play13:08

that are sitting in the market those limit and stop orders and it shows the amount of volume

play13:12

so the amount of supply and demand that is sitting at each individual price level so on

play13:18

the left hand side you have the bids so the amount of demand that is willing to buy at each price

play13:23

level and then you have the offers on the right hand side so commonly referred to as the ask prices

play13:29

which shows the amount of supply at each price level so the top green level is the current

play13:34

best market bid and the bottom red level is the current best market ask and the blue price in the

play13:40

middle that represents that last price level that was traded at so in this case the last trade that

play13:46

was executed was someone buying at the ask price of one spot one five three zero because remember

play13:54

you have to buy at the ask on the right and you sell on the bid price on the left so if you want

play14:00

to sell then you have to sell to the highest bidder and if you want to buy then you can buy from

play14:04

whoever is asking for the lowest price for the product right now when you go and look at your

play14:10

own forex broker what you will see is just the current best bids and the current best ask and

play14:16

then the difference between those two prices is the spread right so in this case the spread would

play14:20

be one point one five three zero minus one point one five two nine which essentially means a spread

play14:26

of one pip so if you wanted to instantly buy an instrument that would be an aggressive order and

play14:32

you would buy at the current best ask price meaning you would hit that passive order at one

play14:37

point one five three zero and you pay the spread of one pip so let's take a look at a very very

play14:43

oversimplified you know a theoretical example of what can happen on the order book in the live

play14:49

market so imagine that this was the order book for euro dollar now let's say that a company over in

play14:55

america they want to buy an innovative tech company that is doing really really well in europe

play15:01

now that american company is going to need euros in order to buy that european company right so they

play15:07

will call up their bank's dealing desk and they will say that let's say they need to buy 20 000

play15:11

lots of euro dollar because they're going to need to sell their us dollars to buy euros right and

play15:16

they tell the bank's dealing desk that they need this transaction completed within 48 hours and

play15:22

please give us the best possible price now the bank's traders you know sitting on that dealing

play15:27

desk they may not want to put through all of those 20 000 lots all in one go because there

play15:32

may not be enough liquidity to fill that huge order without experiencing massive slippage

play15:39

because if we look at this current example if you look on the right hand side we can see the amount

play15:43

of supply that is sitting there on all of those different ask prices now if the bank was to

play15:48

instantly buy at market with those 20 000 lots price will absorb all of the supply on the right

play15:54

hand side you know that huge demand that the bank would be entering into the market

play15:58

it's going to eat up all of that supply and price will just keep going up and up and up until every

play16:05

single one of those 20 000 lots have been filled you know if they were to enter that with an

play16:10

aggressive order so an out market order so what they may do instead is split up the order into

play16:16

smaller parts to hedge the risk of experiencing that negative slippage and see if they can average

play16:21

out a better price for their client so let's keep it simple and let's just say that they enter half

play16:26

of the position now so they press buy on 10 000 lots for an app market execution so they hit the

play16:32

best current ask price and what will happen is the 10 000 total lots sitting on those ask prices

play16:39

will instantly get absorbed and the price will shoot straight up to 1.1539 due to that huge

play16:45

imbalance between supply and demand right because there was an overwhelming amount of demand at

play16:51

that current market level so what did price have to do price had to rapidly shoot up in order to

play16:56

fulfill that huge shift in demand until there was enough supply at a higher price level to balance

play17:02

price back out to you know balance both supply and demand and now the market is sitting at what

play17:07

is deemed to be fair value between buyers and sellers so half of their order has now been filled

play17:15

but the bank doesn't want to you know keep chasing the market higher and higher

play17:18

and get filled at an even worse price for their remaining volume right for those remaining 10 000

play17:22

lots so what they do is they leave the remaining 10 000 lots as a passive order so as a buy limit

play17:28

order back down around that original price level of 1.1529 as this is where they hope that the

play17:35

market will eventually trade back down to fill them within the next 48 hours for their client

play17:41

now if price eventually gets back down to that level of 1.1529 what do you think are the odds

play17:48

that there will be more supply than demand to absorb all of that demand of that huge buy order

play17:54

of 10 000 lots and the rest right to keep pushing price down past that level to keep pushing price

play18:00

down past 1.1529 i would say the probability is that price is more likely to see a bullish move

play18:07

from that price level right the very minimum there will be a bullish bounce right there'll be a bit

play18:11

of a reaction as the market experiences that imbalance between supply and demand at that level

play18:17

so essentially what this does is it gives you a really great edge to look to be buying around

play18:21

that level right with this huge demand and then surf on the coattails of that order flow right

play18:26

of the order flow of the whales of those large institutions in the market now because the spot

play18:32

forex market is an otc market which means it's traded over the counter this means it is a

play18:38

decentralized market so there isn't one central exchange where all of the total volume and all

play18:44

of the total trading activity goes through so you can't really look at an order book of just one

play18:48

liquidity provider and get a super accurate view of what the true total order book looks like

play18:54

for the entire forex market as a whole but we don't need to and also in reality you know reading

play18:59

a price ladder can be very very complicated as all of this buying and selling activity

play19:03

so the interaction between supply and demand is extremely dynamic especially when you throw in

play19:08

the aggressive orders that are hitting the bids and the asks that are sitting there so it can be

play19:12

very hard to read so instead what we use is a price chart and the price chart gives us tons

play19:19

of information on the current and the past prices that have been traded and in the chronological

play19:24

order in which those levels were traded so essentially we just see that middle column here

play19:30

of how price moves up and down those levels but also how quickly price moves up and down those

play19:34

levels and that's where multi-time frame analysis comes into play and that's why we use candlestick

play19:39

charts because they give us a lot of information but you just need to know how to be able to read

play19:44

it effectively so with this example on this order book here of what we just went through

play19:50

how could that example possibly look like on a price chart well how we may potentially see you

play19:56

know something similar to that and the order book theory that we just looked at obviously a very

play20:01

sort of you know oversimplified theory of how it really goes on in the market where we have you

play20:06

know millions of different participants but generally you'll see price kind of chopping

play20:10

around sort of you know ranging sideways moving up and down not really going anywhere with real

play20:15

conviction right just some even distribution between buyers and sellers and then boom what

play20:20

happens we get that overwhelming imbalance between supply and demand right where demand has clearly

play20:26

overpowered supply and we have initiated out that range and broken to the upside right so imagine

play20:31

you know 10 000 the order has just been filled and pushes price all the way up to the upside

play20:36

to try and find as much supply in order to fill all of those those lots that that you know the

play20:42

bank firm or institution wants to buy so price then shoots up to the upside but it's very likely

play20:48

that there's still going to be a lot of sitting demand back within those initial price levels

play20:53

of where there'll be orders and liquidity that price wants to then fill so we will very often

play20:58

see as in price start to make its way back down towards that level back down towards that level

play21:03

pick up those orders and then boom you'll see another imbalance between that supply and demand

play21:08

again as those remaining orders are filled and demand is now fully in control and yeah we just

play21:13

see the same thing happen again and again and again right if you just go and look on any single

play21:18

price chart and you just scroll back right you'll just see the exact same thing happen again where

play21:22

if you have price ranging price initiates out as we get that imbalance between supply and demand

play21:27

price comes back into that demand and it fills the next orders right we get that range price

play21:32

initiates out price comes back in to fill those orders right we get a range pricing initiates

play21:36

out right the origin of that move price comes in to fill more orders and then we move away right

play21:40

we initiate out that range price comes back into full those orders where the demand stepped in

play21:44

and we initiate out that range right we come here break up those highs price comes back in

play21:48

to fill the remaining demand right it just happens again and again and again right price range in

play21:54

We initiate out price comes back in to fill those orders right same thing original range down here, right?

play21:59

That was the origin of the move price comes in a little bit lower to fill those orders, right?

play22:02

It needed more demand to then continue that move and the same thing will just continue to happen

play22:06

Right, just get rid of all that price action and play it forward a bit

play22:09

No, it's on every single time frame, right time doesn't know price present no time

play22:14

It's just orders going through the market that we can then see on those candles right as price continues to move up

play22:19

Right pulls back it ranges demand steps in again to take control

play22:22

Boom, right pull back into demand to then continue to fuel the move

play22:27

Right, and we have this range here demand steps in price comes back in to fill those remaining orders

play22:32

And then we come off right demand steps in price comes back into that demand to then make another move here

play22:37

All right again and again and again

play22:39

So obviously we'll cover this a lot more depth in the charts in a bit

play22:41

But now you can kind of just see how a simple example like that actually is translated onto the candles on the charts

play22:49

So if you're a little bit confused potentially about some of the things that we just discussed in this lesson

play22:54

You know, don't worry too much watch it a few times if you need to just to kind of you know

play22:58

Really make it sink in but when it comes to supply and demand the following is literally all you really need to think about

play23:06

So literally all we're doing is we're just looking for where there are large imbalances between supply and demand

play23:12

That cause those huge shifts in the market. So we are trying to identify the charts

play23:17

You know where an overwhelming amount of demand entered the market to cause price to rapidly move to the upside

play23:22

But then we'll look to buy it when price returns to those areas of demand

play23:26

And then we'll also look for where there was an overwhelming amount of supply that entered the market

play23:31

To cause prices to rapidly move to the downside and we'll look to sell when price returns to those areas of supply

play23:37

Now when we combine this with everything that we already now know about market structure

play23:42

So when we've identified the exact high-value areas of the trend in which we want to position ourselves in

play23:48

Right, we've used multi timeframe analysis to wait for all of those timeframes to sync to give us as much confirmation as possible

play23:54

Then we over overlay that and overlap that with supply and demand that then becomes another

play24:00

Extremely powerful tool to help us with timing and refining our positions and our exits

play24:07

And this is what we're going to dive really deep into over the next few lessons

play24:11

you

Rate This

5.0 / 5 (0 votes)

Etiquetas Relacionadas
Market StructureOrder FlowTechnical AnalysisEconomic BehaviorCurrency ExchangeSupply and DemandPrice ActionTrading PsychologyFinancial MarketsInvestment Strategy
¿Necesitas un resumen en inglés?