What Could Go Wrong with a GraphQL Query and Can OpenTelemetry Help? - Budhaditya Bhattacharya, Tyk
Summary
TLDRThe speaker, a developer advocate, discusses common issues with GraphQL queries and how Open Telemetry can address them. They explore challenges like over-fetching, under-fetching, and the 'N+1' problem, demonstrating how to monitor and troubleshoot using Open Telemetry in a Node.js environment. The talk also covers the importance of semantic conventions and manual instrumentation for better observability, concluding with resources for further learning.
Takeaways
- 😀 The speaker is starting the session early and expects a loud applause at the end, setting a positive and engaging tone for the audience.
- 🌐 The talk focuses on potential issues with GraphQL queries and how Open Telemetry can help address them, providing a practical approach to API management.
- 🔍 The speaker, a developer advocate at Tyk, discusses the challenges and solutions related to GraphQL and Open Telemetry, indicating the relevance of their expertise.
- 📈 The importance of monitoring and observability in production environments is highlighted, emphasizing the need for visibility into the health and performance of distributed systems.
- 📊 The RED method (Rate, Errors, Duration) is introduced as a strategy for gaining insights into service health, suggesting a systematic approach to monitoring.
- 🛠 Open Telemetry is positioned as a tool for instrumenting GraphQL services to capture distributed traces, which is crucial for troubleshooting and performance analysis.
- 🔄 The speaker illustrates the use of Open Telemetry with a Node.js example, showing practical steps to integrate it with a GraphQL service for better observability.
- 📈 The integration of Open Telemetry with Prometheus and Jaeger is discussed, demonstrating how to visualize and analyze metrics for GraphQL services.
- 🚦 The challenges of HTTP status codes in GraphQL are addressed, where a 200 OK response might not always indicate success, and the need for deeper inspection is emphasized.
- 🔍 The 'N+1' problem in GraphQL is identified as a common performance issue, and the use of data loaders is suggested as a solution to prevent excessive database queries.
- 🔄 The importance of granular performance profiling is stressed, moving beyond average metrics to understand the specific needs and challenges of different clients and queries.
Q & A
What is the main topic of the speaker's presentation?
-The main topic of the presentation is discussing what could go wrong with GraphQL queries and how Open Telemetry can help address these issues.
Why might a speaker choose to start a session early?
-The speaker starts the session early because it is the last session of the day and they expect the audience to be with them for the journey over the next 15 to 20 minutes.
What is the speaker's professional background?
-The speaker, Buddha, is a Developer Advocate at Tyk, a cloud-native API management platform. They are also the chairperson of the Open API initiatives business governance board.
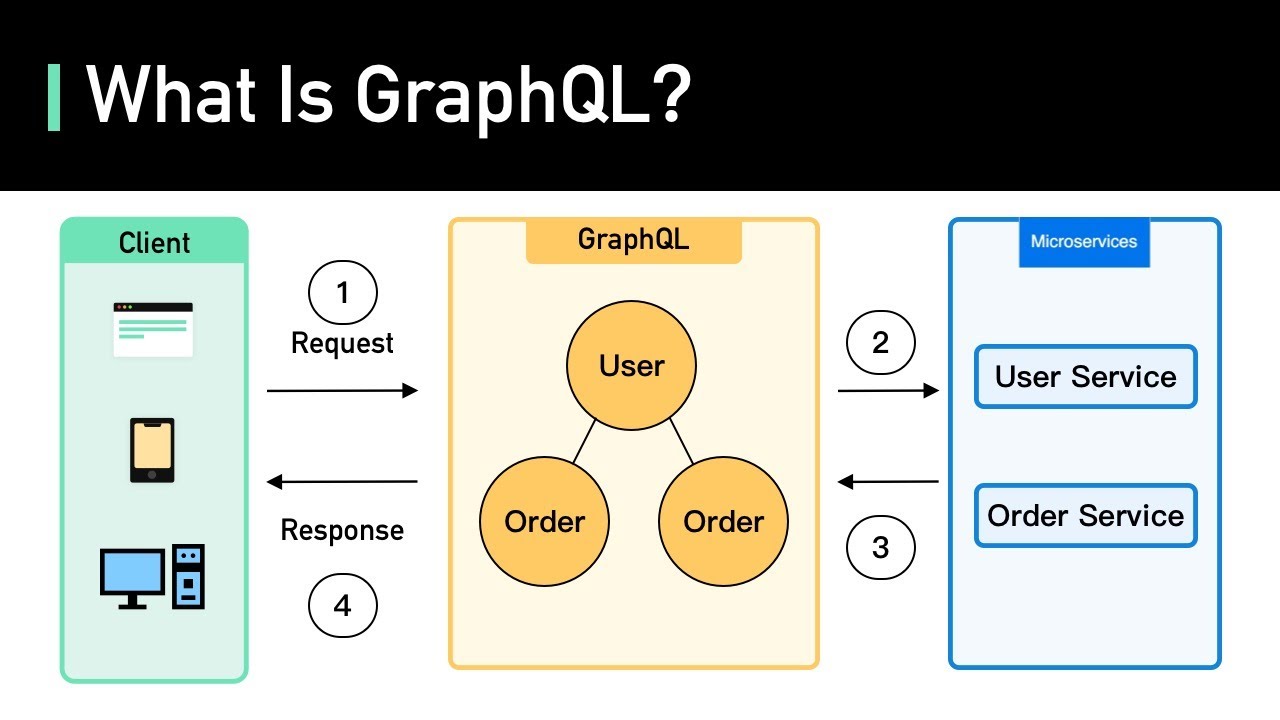
What is GraphQL and how does it differ from REST?
-GraphQL is a query language for APIs and a runtime for fulfilling those queries with existing data. It differs from REST in that it allows clients to request specific pieces of information, addressing issues like over-fetching and under-fetching that are common with REST.
What is the purpose of an API Gateway in the context of GraphQL?
-An API Gateway acts as a mediator between different security protocols, governance practices, and as an entry point for observability, especially when working with GraphQL to ensure reliability and stability in deployment.
What is the RED method in monitoring and what does it stand for?
-The RED method is a monitoring strategy used to gain insight into the health and performance of distributed systems. RED stands for Rate, Errors, and Duration.
How can Open Telemetry be integrated into a GraphQL service?
-Open Telemetry can be integrated by instrumenting the GraphQL service with Open Telemetry to get distributed traces. This involves using specific implementations for the technology stack, such as Node.js, and exporting spans to the Open Telemetry collector.
What are some common performance issues with GraphQL?
-Some common performance issues with GraphQL include the N+1 problem, where multiple requests are made for each resource in a response, leading to inefficient data fetching and high latency.
What is the significance of the 'graphql.error.message' attribute added manually to the GraphQL service?
-The 'graphql.error.message' attribute is significant as it allows for capturing specific GraphQL errors within the spans, providing more detailed information for troubleshooting issues that are not indicated by HTTP status codes.
How can the N+1 problem be detected and addressed using Open Telemetry?
-The N+1 problem can be detected by monitoring the number of outgoing requests for a GraphQL query. If the number is unusually high, it may indicate an N+1 issue. Open Telemetry can help identify this by providing detailed tracing information, and it can be addressed by implementing data loaders or other optimization techniques.
What resources does the speaker provide for further learning about Open Telemetry and API observability?
-The speaker provides courses on Open Telemetry API observability and API platforms, and encourages attendees to connect with them on LinkedIn for more information.
Outlines
📝 Introduction to GraphQL Challenges and OpenTelemetry
The speaker introduces the session by expressing anticipation for a lively and engaged audience, emphasizing that despite being the last session, the topic is important and promises a rewarding journey. The session focuses on potential issues with GraphQL queries and how OpenTelemetry can be a solution. The speaker clarifies that they are not promoting GraphQL but addressing challenges that developers might face, especially those already using or considering GraphQL. The speaker's background and role at Tyk, a cloud-native API management platform, are shared, along with their involvement in the open API initiative. The session aims to explore both development and operational aspects of deploying a GraphQL application to production, highlighting the importance of stability and reliability.
🌐 Understanding GraphQL and Its Implementation
This paragraph delves into the specifics of GraphQL as a query language for APIs and its runtime for fulfilling queries with existing data. It emphasizes the ease of describing data and the flexibility it offers to developers to request specific data needed for their applications. The speaker contrasts GraphQL with REST, highlighting the issues of over-fetching and under-fetching that GraphQL can address. An example of a GraphQL query is given to illustrate how the request shape mirrors the response, making the data retrieval process more predictable. The paragraph also sets the context for a sample travel application that uses GraphQL, discussing the components involved in the server-side and the types of applications that can benefit from GraphQL, especially those with multiple clients or needs.
🛠️ Utilizing OpenTelemetry for GraphQL Monitoring
The speaker introduces the RED method, a monitoring strategy for gaining insights into the health and performance of distributed systems, and explains how it can be applied to monitor GraphQL in production. OpenTelemetry is presented as a tool for instrumenting the GraphQL service to capture distributed traces. The process of setting up OpenTelemetry with the travel application, including the use of the trace.js file and exporting spans to the OpenTelemetry collector, is detailed. The integration of RED metrics in Jager is discussed, including the use of Prometheus to store and display metrics, ultimately providing a dashboard for monitoring request rates, error rates, and durations for the GraphQL service.
🚑 Troubleshooting GraphQL with OpenTelemetry
This paragraph discusses the troubleshooting process for GraphQL using OpenTelemetry, starting with identifying upstream errors and resolver errors. The speaker provides a scenario where an error in the Weather Service leads to a 500 HTTP status code in the GraphQL service. The use of Jaeger's dashboard to identify and address the error rate increase is explained. The paragraph also touches on the challenge of GraphQL's HTTP status code always being 200, even when errors occur, and how this can be mitigated by adding a 'graphql.error.message' attribute for better error tracking. The importance of not relying solely on the HTTP status code for assessing the health of a GraphQL service is highlighted.
🔍 Addressing GraphQL Performance Issues with OpenTelemetry
The final paragraph addresses the performance challenges of GraphQL, specifically the 'N+1' problem, where a single query leads to multiple subsequent calls for each resource, causing performance bottlenecks. The speaker explains how OpenTelemetry can help detect this issue by analyzing the number of outgoing requests per GraphQL query. The use of data loaders as a solution to the 'N+1' problem is mentioned. The paragraph concludes with a call to action for the audience to contribute to the development of semantic conventions for GraphQL within OpenTelemetry and to consider the limitations of current instrumentation practices. The speaker wraps up the presentation with a reminder of the resources available and an invitation for further discussion.
Mindmap
Keywords
💡GraphQL
💡OpenTelemetry
💡RED Method
💡API Gateway
💡Over-fetching and Under-fetching
💡N+1 Problem
💡Data Loaders
💡Semantic Conventions
💡Tracing
💡Prometheus
💡HTTP Status Codes
Highlights
The session discusses potential issues with GraphQL queries and how Open Telemetry can assist in addressing them.
The speaker, Buddha, introduces himself as a Developer Advocate at Tyk, a cloud-native API management platform.
Buddha shares his experience with the Seattle community and his involvement with the Open API Initiatives business governance board.
The importance of GraphQL in omni-channel applications and its advantages over REST for specific challenges like over-fetching and under-fetching is highlighted.
An explanation of GraphQL's query language for APIs and how it allows clients to request specific data needs is provided.
The speaker uses a travel application as an example to demonstrate the practical use of GraphQL and its components.
The benefits of a GraphQL-aware API Gateway in observability and its role as a mediator between security protocols and governance practices are discussed.
The RED method for monitoring distributed systems is introduced, focusing on rate, errors, and duration metrics.
The process of instrumenting a GraphQL service with Open Telemetry for distributed tracing is outlined.
Jaeger's integration with Open Telemetry for visualizing traces and generating RED metrics is explained.
The challenges of troubleshooting GraphQL in production, especially when HTTP status codes do not reflect the actual state of the request, are covered.
The addition of a custom 'graphql.error.message' attribute to improve error visibility in Open Telemetry traces is demonstrated.
The 'N plus 1' problem in GraphQL and its performance implications are discussed, along with using Open Telemetry to detect such issues.
The need for granular performance profiling in GraphQL due to the flexible nature of queries and the challenges it poses is highlighted.
The limitations of semantic conventions in GraphQL and the importance of manual instrumentation for better error tracking are covered.
The speaker concludes by summarizing the benefits of Open Telemetry for both developers and operational teams in enhancing GraphQL API reliability.
Buddha offers additional resources and courses on Open Telemetry, API observability, and API platforms for further learning.
Transcripts
we're starting a couple of minutes early
because this is after all the last
session of the day so um I am expecting
the loudest Applause at the end of it
but hopefully you'll be with me on this
journey over the next 15 to 20 minutes
so thank you everyone for being here um
this has been a great open tary
Community this was my first time
speaking in Seattle uh and meeting a lot
of the folks that I've seen over
LinkedIn or YouTube videos or guub
issues in person which is great um so
with all that being said um I'm here to
talk a little bit about what could go
wrong with graphel queries and can open
Telemetry help us um I assure you it's
not going to be a bummer off a topic at
all even though the name might suggest
it that way um but um if murph's law
suggests that uh whatever can go wrong
would potentially go wrong or whatever
can happen will happen so let's just be
prepared uh when that happens I'm not
here I'm not going to be evangelizing
graph Cur as a technology so just as a
caveat to this uh I'm not trying to sell
you on using graphql but if you are
already sold onto that or considering
doing it then uh there are a couple of
things and challenges that you might
encounter and we'll go through some of
those uh and hopefully we'll see how
open Telemetry um can solve or address
some of those things either out of the
box or potentially with certain manual
instrumentations associated with it so
with that being said I am Buddha I am a
developer Advocate at Ty Ty for those
who do not know is a cloud native API
management platform powered by and uh an
open source API Gateway we are otel
native as well as um we are graphical
aware as an API Gateway um and I can
tell you all about that later on but the
idea is we kind of know a little bit
more about both of these different
worlds some of the challenges some of
the solutions associated with it um I'm
originally from India um lived most of
my life in Singapore currently living in
Durham North Carolina big big fan of
horror movies but I like my horror on
screen and in literature not so much in
software as you would see with craft Q
today um
additionally I'm the chairperson of the
open API um open API initiatives
business governance board in case you're
working in there as
well so um just to set the scene for
today um I'm looking at two sides of
when and how you are sort of promoting
or or or deploying an application in
this case a graph application to
production uh on one side obviously is
the development side of things where
you're looking at the different
capabilities your business logic of how
you're building out your graphical
application on the other side is a
little bit to do with your operations
how do you make sure that things are
stable they are deployed reliably and
things don't go wrong and when they do
you at least have a way to actually
address those things so I'm going to be
looking at both of those different sides
and hopefully help you get to that next
step in that Journey so without before
moving forward uh just a quick question
anyone here who's actually worked with
graphql before or is working with
graphql at the moment considering
working with graphql at the
moment okay all right once again I'm not
going to be trying to convert the others
who did not raise their hands over here
but hopefully address some of the
challenges that you might be facing here
um so for those who do not know graphql
is um it's a query language for apis and
um a runtime for fulfilling those
queries with your existing data it
usually gives you a very very easy
hopefully straightforward way to
describe your data and then let or
enables your client side or the DU
developers to actually ask for what they
need for their application and then
hopefully give those results in a more
predictable way the key difference or
the key value of actually having graph
as a technology is usually seen uh in
Omni Channel application especially when
you have to cater to different needs of
the of the consuming application this
was kind of the main reason why it was
for created in the first place at
Facebook um there are a couple of other
things that again when we talk about
grafal we we have to talk about rest as
well and I think again rest as an API
technology is usually a very very robust
uh way of dealing with apis and API
Styles but with some of these uh with
graphel we saw we noticed that there
were a couple of challenges that the
rest was kind of unable to solve um
namely over fetching and under fetching
in this case over fetching typically
refers to um returning or getting back a
lot of information more than what you
might need and then enabling your or
letting the heavy lifting being done in
the front end whereas with under
fetching you need to have multiple
Cycles or multiple queries to be get to
get back um the specific kind of
information that you need in some cases
this might be desirable but in most
cases that adds to the overall Network
cost or your payload costs moving on
just to give you a little bit of an
example of what graph qu looks like in
practice there is a schema just kind of
the blueprint of your overall graph API
um then the operations usually is
queries are the most typical
applications uh operations that you do
with graphql um you also have mutations
and subscriptions but you're not going
into those but the key thing to notice
over here is that the shape of the
response tends to mirror the shape of
the request which makes things a lot
more predictable in the way you um
receive or get information and again you
can request specific pieces of
information out of the schema as opposed
to getting back every single thing that
has been enabled by the API producers in
this case so with that being said um I'm
going to set the scene again today for
the application that we're going to be
using as a sample in this case this is a
travel application the server side
includes a couple of different
components there are a few different
services that you see there are a couple
of rest apis that are being called as
part of the graphql application in some
cases you can go directly building out
your own schema in some cases you
actually connect with existing data
points as well both of these completely
valid uh the application itself is no JS
application even though some might say
JavaScript is not a language but sure
we'll we'll we'll talk about that later
on um in the simplest use case of a
graphql application you would you would
have a react app or a front end a single
front end that is making this call uh in
which case graph C may not be the right
way because it might be a little bit
going over board whereas a more typical
applications would be that you have
multiple applications or multiple
clients making these requests you might
have different apps that could be
internal facing could be partner facing
could be an API Marketplace of its own
that would that you would need to
consider so with that again definitely
one of the components that you do need
to consider is an API Gateway typically
um and again I'm not just saying it
because I work in this space but a
graphel aware mature graphel aware API
Gateway adds a whole range of benefits
again when you're working with
observability specifically because it
acts as the name suggest as a Gateway
into your application but also as a
mediator between the different uh
security protocols and measures that you
might be integrating with as well as
different governance practices out there
and when you're thinking about end
tracing or endtoend observability
ideally you need to consider every
single component of your stack
now how do you monitor graphql in
production and one of the ways of doing
that is to apply the red method for
those who are not familiar with the red
method the red it is a monitoring
strategy that um that is used to gain
insight into the health and performance
of distributed systems um typically the
red stands for the rate errors and
duration and again if you're familiar
with it that's great based on these
metrics you can understand how good your
service is doing and uh set up your slos
according accordingly now to think about
how we can start adding open Telemetry
to the travel app that we just saw the
first step is to instrument your graphql
service with open Telemetry to get
distributed traces um and again now
there are there are different
implementations of graphql available in
the market in this case we've gone
specific to the nodejs instrumentation
in case you're looking for one that is
specific to your application U you can
always always go to the open Telemetry
website and under ecosystems is search
for um the instrument mation
requirements there and nothing we found
one for nodejs at least in this case uh
moving right along so we use the trace
JS file uh to instrument our service
with open Telemetry and this is how we
add the graph Cel instrumentation here
you'll also notice that we are exporting
the spans to the open Telemetry
collector uh and we see the result uh
that we have we have got endtoend
distributor traces in jger um and we can
see Ty API Gateway starting off the
trace as an entry point um for the
transaction and then reporting some
spans then the graph Feld Services take
over afterwards and then it goes into
sort of the underlying rest apis the
Upstream apis to go with it so now that
we've got all the setup done let's move
forward into how you're going to be
getting the red metrics integrated
Jagger already has some of these outof
the boox Integrations available uh it
uses a component in The oel Collector
called the span metrics connector to
generate these metrics based on the
spans um and the span metric selector
creates two metrics based on uh the span
itself the calls total and um the
latency I believe a latency count so
those metrics are stored in Prometheus
and Jer and will connect to Prometheus
to display these uh
metrics uh finally this is kind of the
dashboard you finally have a look at
this uh in the monitor tab you can now
see the request rate you can see the
error rate um and the duration for your
graphql service so we're all all good to
go now let's look at some of the
possible errors that might happen we'll
be looking at two of them one of them is
the Upstream errors and the other one is
a resolver error um so the first one as
you can see here I'm trying to uh send a
request to to get information about um
the country Italy in this case um along
with its weather data but um there seems
to be something that's gone wrong as we
can see from the message over there
we're not getting the right response so
now let's look at how we can start
troubleshooting this so if you look go
straight into the dashboard uh the Jaga
dashboard you will already see that
there is an increase in the error rate
um and I can then we can as a next step
of this we can start looking at the
traces and I can find within the Traces
by filtering them in Jer using the error
tag uh you'll be able to see that a the
the the you can actually see that you
can um the graph service itself is
giving a 500 HTTP status code and uh
that is because it's a consequence of uh
The Weather Service itself returning a
400 ER the external Upstream Weather
Service that we are connected to so in
this example I can get all the
information I need from open Telemetry
and I can check out uh which query is
having this issue as well if you wanted
to go a little bit deeper a little bit
more specific so done resolved fixed
that issue and now we're all back and
back and happy the final one we go into
the U the resolver issue here um this to
be a little bit more unique so we'll
we'll go into that a little bit right
now where again we we see an error that
is that is being um shown here um but in
this case when we look at the dashboard
we're not really getting a hint as to
what's really going on in this case um
neither can we find something over here
it looks like everything is fine so
we're not really able to reproduce this
at this stage now there is a reason for
this because for those who are again
familiar with graphql a big challenge
with graphql is that at a status code
level the HTTP status code typically
Ally even when things are going wrong
tends to give back a 200 um response and
that has its own challenges so even if
things are not going well graphel can be
the perfect Optimist pretty much turning
a blind eye to what's going on
underneath so you don't want that you
obviously want to get to the heart of
the issue in this case um and as you can
see the the object body or the the
response body is where you can actually
see the errors coming up and it has its
own object where you can see some of the
different details around it has message
and it has location but how do we catch
this as an error um so let's let's go
diving a little bit into the semantic
convention that's associated with
graphql at this point of time and it
looks like it's a little bit limited
there are a couple of different options
available here but it doesn't go into
say a graphel error it's not giving me
the specific um is specific conventions
that I would need to actually get to the
heart of this issue in this case so
let's just add our own attribute and
we're going to be calling it a graphql
error. message and uh with with some
manual
instrumentation I've added that now into
my code and now I can start seeing um
the errors being recorded on my spans
one thing you will still notice is that
the entry point is still giving me a 200
because that doesn't change here but we
are getting a bit more information here
and especially if you go into Prometheus
in this case we can find out that their
error rates are being reported based on
the manual instrumentation that has
happened so that's just something to
keep in mind when you're working with
graphql the HP status 200 is not always
uh an indicator that everything is fine
and then finally we talk about a little
bit about performance here um one of the
other challenge of graphql is that um
the end point of a graphql API is
typically again a slash graphql or
something to that effect so the main
changes or updates the requests that are
going through are again at a layer below
which is in the form of queries so you
can still be calling that same endpoint
but requesting different forms of data
um and that could be very very flexible
in the way in whichever way the the
requester wants it to be so if they can
essentially call it an any particular
order that they want to that shape could
be completely different for every single
one of the requests that they might make
so this obviously poses a little bit of
a challenge um where there could be you
know we could have multiple clients
consuming this API each in their own own
way um but it also poses that challenge
of um how do you then profile that
performance because uh what could be
right for a specific query for a
specific client uh may not be right for
the others so how do you actually start
looking or thinking about that a little
bit more so what you need in this case
is while that P95 value over there um is
an indicator of some things it's really
not enough because it's just giving you
an average um overall error rate or
latency rate in this case uh which again
doesn't give you the full picture so we
need to go a little bit more granular in
this case and there are some typical
performance issues that can be seen with
graphql um we are not going to go into
each one of them given a few minutes
left for us um so I'm going to just talk
about the first one but we I'm happy to
discuss the remaining ones um directly
with you if you wanted to have a chat
but the most typical performance issue
that you see here is the n plus1 issue
again if you're not familiar with it um
it BAS basically means that when you're
making a request or or querying some
data it the first response is to get
back a set of um set of set of
information or resources and then as a
subsequent call you're essentially going
into each one of those resources and
making a query for each one of them
hence the N plus1 problem it is fixable
by using things like data loaders but it
can also be quite easily overlooked and
you don't want that because it has a lot
of huge performance implications for
graphical apis um so how do you solve
that there's actually a fairly
straightforward way to doing to to to
actually solving this um in this example
again you can see that you know a very
simple query has actually gone into a
pretty much of a cycle where you've got
multiple uh continents and countries
coming up as the response with open
Telemetry uh you can nicely detect this
n n plus1 query problem uh in this
particular example if you look at this
dashboard with jerger you'll see that
within the stay diagram that one query
has led to 27 HTTP get calls uh and
that's a typical indicator that
something is going wrong in which Cas in
this case specifically n plus1 um is is
likely the cause here so you can even
get that number in Prometheus if you
wanted to look at it um so getting an
average number of outgoing requests for
graphical query if it's that high
typically means that something is wrong
and in this case that is probably an N
plus1 problem you can set alerts in test
or in your production environment to
actually um get to know when this is
happening
then finally the final steps here um so
we've kind of understood a little bit
more about what's going on um we spoke
about um the open limit is still useful
as a way to troubleshoot your graph fuel
apis uh but there are still certain
things that you need to consider
including you know the semantic
inventions are still a little bit
limited uh it needs to be a little bit
more specific in terms of graphql um and
then the instrumentation providers or
the instrumentation vendors may not
always respect the common semantic
convention and may have their own
implementations and that could pose its
own challenge um but um it's a work in
progress where I think we've started
contributing a little bit more in this
area uh we opened up an issue here so
feel free to comment and uh add your uh
considerations your um you know
contributions to this um hopefully this
takes the shape of something a little
bit more formal over the next um few
months and years and with that um it
looks like everyone's happy at this
point hopefully we to address some of
the key challenges around graphql with
open Telemetry in production um both
sides of the party the developers as
well as the operational side is is a bit
more happy having a little bit more
reliability baked into their system so
that's it uh the final talk hopefully
with five minutes left for today um
that's that's me um on the right hand
side there is there are a couple of
resources um I've created a couple of
courses around open Telemetry API
observability and API platforms feel
free to check those out or connect with
me on LinkedIn if you so desire so with
that um I come to the end of the
presentation and hopefully all
presentations for the day so thank you
so much appreciate it
Weitere ähnliche Videos ansehen
GopherCon 2020: Ted Young - The Fundamentals of OpenTelemetry
Data Loaders (the N+1 problem) - GRAPHQL API IN .NET w/ HOT CHOCOLATE #6
Telemetry Over Events: Developer-Friendly Instrumentation at American... Ace Ellett & Kylan Johnson
Using Native OpenTelemetry Instrumentation to Make Client Libraries Better - Liudmila Molkova
OpenTelemetry for Mobile Apps: Challenges and Opportunities in Data Mob... Andrew Tunall & Hanson Ho
How OpenTelemetry Helps Generative AI - Phillip Carter, Honeycomb
5.0 / 5 (0 votes)