07 Independent Samples t-Tests in SPSS – SPSS for Beginners
Summary
TLDRThis video from RStats Institute at Missouri State University teaches how to perform an independent samples t-test in SPSS to compare means between two groups, using gender as an example. It guides through the process of setting up the test, interpreting the results, and determining statistical significance for variables like height and weight. The video also emphasizes the importance of calculating effect size for a comprehensive analysis and points to additional resources for further learning.
Takeaways
- 📚 This video is part of a series on SPSS for Beginners by RStats Institute at Missouri State University.
- 🔍 The lesson focuses on comparing means between two independent groups using an independent samples t-test.
- 👦👧 It uses a dataset with a 'Gender' variable to compare males and females on measurable variables like height and weight.
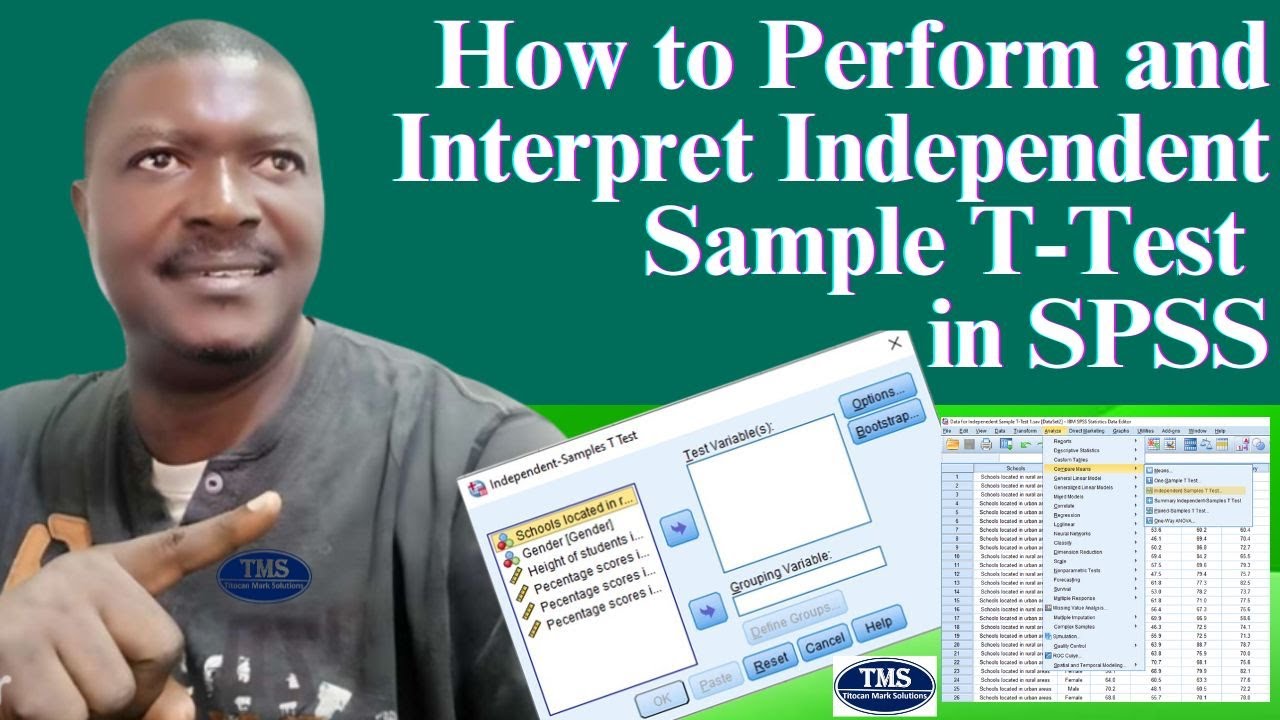
- 📊 To perform the t-test, the 'Analyze -> Compare Means -> Independent Samples t-Test' path in SPSS is followed.
- 📝 Variables measured (height and weight) are entered into the 'Test Variable(s)' box, and 'Gender' is used as the grouping variable.
- ⚠️ SPSS requires clarification on the coding scheme for the groups, necessitating the definition of Group 1 (males) and Group 2 (females).
- 📉 Descriptive statistics are provided, including sample size, mean, standard deviation, and standard error for each group.
- 📊 Inferential statistics table includes the t-score, degrees of freedom, and p-value to determine significance.
- 🔑 There are two rows for each t-test: one assuming equal variances and one not assuming, with the former being the primary focus for now.
- 🔎 Three methods to determine statistical significance are mentioned: comparing t-value to a critical value, checking the p-value against .05, and examining the confidence interval for crossing zero.
- 🤔 The video concludes that while there is no significant difference in height between males and females, there is a significant difference in weight.
- 📈 The importance of calculating effect size in addition to p-value and confidence interval is highlighted, with a reference to an RStats Effect Size Calculator for further exploration.
Q & A
What is the primary focus of this SPSS tutorial video?
-The primary focus is to compare the means of two independent groups (males and females) using an independent samples t-test.
Why do we use an independent samples t-test in this scenario?
-We use an independent samples t-test because the two groups (males and females) are independent of each other and each group is measured only once.
What variable is used to define the two groups in this tutorial?
-The variable 'Gender' is used to define the two groups, with '1' assigned to males and '2' assigned to females.
Which variables are measured to compare the groups in this test?
-Height and weight are the variables measured to compare the groups.
What steps are taken to set up the independent samples t-test in SPSS?
-The steps include going to Analyze -> Compare Means -> Independent Samples t-Test, moving height and weight into the variables box, and moving gender into the grouping variables box. Then, defining the groups by assigning '1' to males and '2' to females.
What information does the descriptive statistics table provide?
-The descriptive statistics table provides the sample size, mean, standard deviation, and standard error of the mean for each group (males and females).
How do we determine if there is a significant difference between the means of the two groups?
-We determine significance by comparing the t-value to a critical value, checking the p-value to see if it is smaller than 0.05, and examining the confidence interval to see if it crosses zero.
What were the results for height and weight in terms of statistical significance?
-For height, the t-value and p-value indicated no significant difference, and the confidence interval crossed zero. For weight, the t-value and p-value indicated a significant difference, and the confidence interval did not cross zero.
What were the mean weights for males and females, and what conclusion was drawn?
-The mean weight for males was 142.8 pounds, and for females, it was 123.2 pounds. It was concluded that males weighed significantly more than females.
Why is it important to calculate effect size in addition to p-value and confidence interval?
-Effect size is important because it provides the size of the effect, which gives more information about the practical significance of the difference between the means.
Outlines
📊 Independent Samples t-Test Introduction
This paragraph introduces the seventh video in the SPSS for Beginners series by RStats Institute at Missouri State University. It focuses on comparing the means of two different groups measured independently, specifically males and females, using an independent samples t-test. The video explains the process of selecting the 'Gender' variable for group categorization and the 'Height' and 'Weight' variables for measurement. It also details the steps in SPSS to perform the t-test, including specifying the groups and interpreting the output, which includes descriptive and inferential statistics. The paragraph emphasizes the importance of understanding the t-value, degrees of freedom, and p-value to determine if the mean differences are statistically significant.
🔍 Interpreting t-Test Results for Height and Weight
The second paragraph delves into the interpretation of the t-test results for height and weight differences between males and females. It explains the three methods to determine statistical significance: comparing the t-value to a critical value from the Student's t-table, examining the p-value against the .05 threshold, and assessing whether the confidence interval crosses zero. The video script reveals that while height differences were not statistically significant (p-value of .058), weight differences were (p-value of .009). The descriptive statistics confirm that males weighed more on average than females, but there was no significant difference in height. The paragraph concludes by highlighting the importance of calculating effect size for a more comprehensive understanding of the results and encourages viewers to explore additional resources for further learning on t-tests, statistical theory, and APA style reporting.
Mindmap
Keywords
💡SPSS
💡Independent Samples t-test
💡Descriptive Statistics
💡Inferential Statistics
💡Degrees of Freedom
💡p-value
💡Confidence Interval
💡Effect Size
💡Coding Scheme
💡Statistical Significance
Highlights
Introduction to the seventh video in the SPSS for Beginners series by RStats Institute at Missouri State University.
Explanation of comparing means between two different groups using an independent samples t-test.
Use of the same dataset from the first video to demonstrate the process.
Identification of 'Gender' as the variable to create two groups: males and females.
Selection of 'height' and 'weight' as measurable variables to compare between groups.
Guidance on navigating the SPSS interface to perform an Independent Samples t-Test.
Instructions on assigning group codes in SPSS for the 'Gender' variable.
Clarification on why it is necessary to define groups in SPSS, even with only two.
Running the t-test and obtaining descriptive statistics for each group.
Interpretation of inferential statistics, focusing on the t-score, degrees of freedom, and p-value.
Differentiating between results assuming equal variances and not assuming equal variances.
Method of determining statistical significance using t-value, p-value, and confidence interval.
Finding that there is no significant difference in height between males and females.
Conclusion that there is a significant difference in weight between males and females.
Explanation of the importance of calculating effect size in addition to p-value and confidence interval.
Introduction of the RStats Effect Size Calculator for t Tests for computing effect sizes.
Encouragement to subscribe for more videos on SPSS for Beginners and statistical theory.
Transcripts
Welcome to the seventh video in SPSS for Beginners from RStats Institute at
Missouri State University. In the last video, we learned how to compare
means when the same sample was measured twice. In this test, we are going to
measure one group (males) and then measure a second group (females) and then see if
the mean for males is statistically significantly different than the mean
for females. Two groups measured one time. Because each of the groups are
independent of each other, we will use an independent samples t-test. Using the
same data set that we created in the first video, let's look at the variables.
We need two groups. The variable "Gender" will work nicely for these groups. We
have males and females. We need to measure the groups on something that can
vary. We measured height and weight, so we can answer a question like: "is there a
significant difference in height between males and females." So let's do it. Go to
Analyze -> Compare Means -> Independent Samples t-Test. the first thing that we
need is the variable that we measured. So, we measured both height and weight. So
let's get crazy and examine both variables at the same time. We will move
both height and weight into the variables box. And, we want to compare
between groups, so we move gender into the grouping variables box. But notice
that okay is still not available? And we have these question marks? What else do
we need to do? SPSS is telling us that it does not know what
our coding scheme is. We need to tell SPSS what are the two groups. Now, you may
ask: "WHY do we need to tell SPSS about the groups? We only have two groups."
Yes, WE have two groups, but there may be times that you are using a categorical
variable coded for multiple groups, like freshman, sophomore, junior, senior. But we
only want to compare freshmen to seniors. So, ee have to be able to specify which
of the groups should be compared. Click on Define Groups. For Group 1, we
will assign "1", which is males; and for Group 2, we will assign "2" for females.
Now we have our two groups. Click Continue and you can now see that OK
is available. So we are ready to run this test. Click OK.
Just as before, we get one table with descriptive statistics. It tells the
sample size, the mean, the standard deviation, and the standard error of the
mean for each of our groups: males and females. Below that, we see the table
containing the inferential statistics. We can mostly focus on this middle part of
the table. We have the t-score, the degrees of freedom for our two groups,
and the p-value that corresponds to that t score at those degrees of freedom,
which we use to determine if there is a significant difference, or not. So I want
to mention that for each t-test there are two rows, each with different results
for the test. The top row is for equal variances assumed, and the bottom row is
for equal variances NOT assumed. You will learn all about what that means later.
For now it's okay to just stick with the top row.
Remember that there are
three ways to determine statistical significance. First,
we can compare our t-value to a critical value that we look up in a table called
Students t Table. So I did that, and for 8 degrees of freedom, the critical
value is 2.306. This will be the same critical value for both
of these t tests. For height, the t-value is 2.214, which is
smaller than our critical value of 2.306. But, the t-value for
weight is 3.413, which is larger than our critical value
of 2.306. When the t-value
exceeds the critical value, then
the means are different. We can also look at the probability value to see if it is
smaller than .05. The p value for height is .058, slightly
larger than .05, but the .009 for weight is
smaller than .05. And we can look at the confidence interval to see
if it crosses zero. For height, the lower value is negative and the upper value is
positive, so it crosses zero. Not different. For weight, both values are
positive, so it does not cross zero.
So what do you think? Were there any
significant differences for height or weight?
Height was NOT different, but
weight was different. We can check the actual means in the Descriptive
Statistics, for more clarity. Males weighed 142.8 pounds and
females weighed 123.2 on the average. So males weighed significantly
more than females, but their Heights were not statistically significantly
different. You know, I've been talking about "statistical significance" as if it
tells the whole story, but that is not actually correct. There is something else
that we should calculate in addition to the
p-value and the confidence interval. We should calculate the effect size. I have
another video in which I go into a great deal of explanation about effect sizes
and why they matter. For now, just know that an effect size is exactly what it
says on the tin: it is the size of the effect the difference between the means.
Check out the RStats Effect Size Calculator for t Tests, for a spreadsheet
that you can use to compute effect sizes directly from SPSS output. When you're
ready to do an independent samples t-test for real, check out these other
videos from RStats Institute that will teach you more about statistical
theory, setting up your t-test, interpreting the results, and writing up
your findings in APA style. Thanks for watching these videos about SPSS for
Beginners from RStats Institute at Missouri State University. We have one
more short video to wrap up this series. If you've liked these videos so far, be
sure to subscribe and have all of our videos available for your viewing when
you take your statistics course.
Weitere ähnliche Videos ansehen
5.0 / 5 (0 votes)