TEST SYSTEM TRADING MACD dan EMA (500) : Winrate bagus
Summary
TLDRThis video demonstrates a backtesting strategy combining EMA 500 and MACD indicators to analyze trading performance over 50 trades with a starting capital of $1,000. The presenter explains setting up trades using a Google Sheet or Excel template, applying a 1:2 risk/reward ratio, and placing stop losses at previous highs or lows. The EMA 500 filters trend direction, while MACD crossovers confirm buy or sell entries. The backtest resulted in a 44% win rate and a 16% capital gain. The video highlights the strategy's smooth growth, avoidance of consolidation trades, and potential to miss high-profit trends, making it a steady, cautious approach to trading.
Takeaways
- 📈 The strategy combines EMA 500 and MACD for trend-following and entry signals.
- 💹 EMA 500 determines trend direction: above EMA → bullish, below EMA → bearish.
- 🔵 MACD crossovers confirm buy or sell positions depending on position relative to the black line.
- 💰 The backtesting uses a virtual starting capital of $1,000 with a 1% risk per trade.
- ⚖️ Risk-to-reward ratio is set at 1:2, meaning stop loss is half of the take profit.
- ⏱️ The preferred timeframe for this strategy is 15 minutes for entry execution.
- 📊 Backtesting over 50 trades resulted in 28 wins and 22 losses, giving a 44% win rate.
- 💵 Total profit from the 50 trades was $160, which is 16% of the initial capital.
- 🛡️ The strategy avoids trading during consolidation, reducing unnecessary losses.
- ⚠️ A drawback is that strong trends may be missed, limiting maximum profit potential.
- 🎯 The method is suitable for consistent traders aiming for steady returns rather than high-risk, high-reward trades.
- 📂 The video encourages using additional indicators like RSI or Stochastic to enhance strategy performance.
Q & A
What is the main focus of the video?
-The main focus of the video is backtesting a trading strategy that combines the EMA 500 (Exponential Moving Average) and MACD (Moving Average Convergence Divergence) indicators to evaluate its performance over 50 trades.
What is the starting capital used for the backtesting?
-The starting capital used for the backtesting is $1000, but it is simulated in a virtual environment using a Google Sheet setup.
How are the win and loss amounts calculated in the backtesting?
-For each win, the profit is $20, and for each loss, the loss is $10, based on the initial $1000 virtual capital. The system follows a risk and reward ratio of 1:2.
What risk and reward ratio is applied in this backtest?
-The risk and reward ratio applied is 1:2, meaning for every $10 loss (stop loss), the profit target is $20 (take profit).
What is the win rate of the strategy after 50 trades?
-The win rate after 50 trades is 44%, with 22 wins and 28 losses.
What does the EMA 500 indicator represent in this strategy?
-The EMA 500 is used to determine the overall market trend. If the price is above the EMA 500, the market is considered to be in a bullish trend, and if it is below, it is considered a bearish trend.
How does the MACD indicator work in this strategy?
-The MACD indicator helps identify overbought or oversold conditions by showing the relationship between two moving averages (fast and slow). A crossover of the MACD line over the signal line indicates a potential buy, while a crossover below suggests a sell opportunity.
How does the backtesting process handle trades that are in profit or loss?
-The Google Sheet tracks the performance of each trade. If a trade is a win, the capital increases by $20; if it’s a loss, it decreases by $10. The win/loss rate and overall performance are updated automatically.
What were the results of the backtesting in terms of profit?
-The total profit after 50 trades was around 16% of the initial $1000, or $160, demonstrating that the strategy is effective, albeit with room for improvement.
What is the main advantage of using the EMA 500 and MACD together in this strategy?
-The combination of EMA 500 and MACD provides a clear indication of the trend (using EMA) and overbought/oversold conditions (using MACD). This dual confirmation helps improve trade entry decisions and filter out weak signals.
Outlines

Dieser Bereich ist nur für Premium-Benutzer verfügbar. Bitte führen Sie ein Upgrade durch, um auf diesen Abschnitt zuzugreifen.
Upgrade durchführenMindmap

Dieser Bereich ist nur für Premium-Benutzer verfügbar. Bitte führen Sie ein Upgrade durch, um auf diesen Abschnitt zuzugreifen.
Upgrade durchführenKeywords

Dieser Bereich ist nur für Premium-Benutzer verfügbar. Bitte führen Sie ein Upgrade durch, um auf diesen Abschnitt zuzugreifen.
Upgrade durchführenHighlights

Dieser Bereich ist nur für Premium-Benutzer verfügbar. Bitte führen Sie ein Upgrade durch, um auf diesen Abschnitt zuzugreifen.
Upgrade durchführenTranscripts

Dieser Bereich ist nur für Premium-Benutzer verfügbar. Bitte führen Sie ein Upgrade durch, um auf diesen Abschnitt zuzugreifen.
Upgrade durchführenWeitere ähnliche Videos ansehen
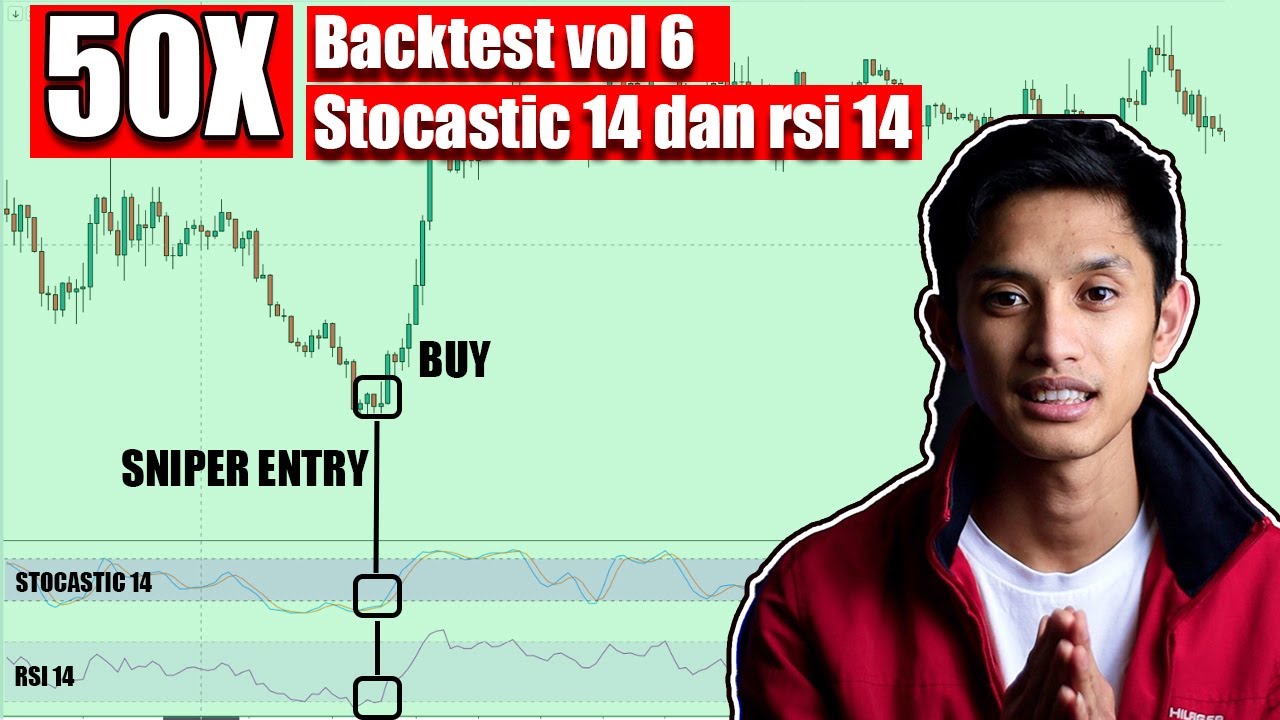
Backtesting 50 kali vol 6 - Stocastic 14 dan RSI 14
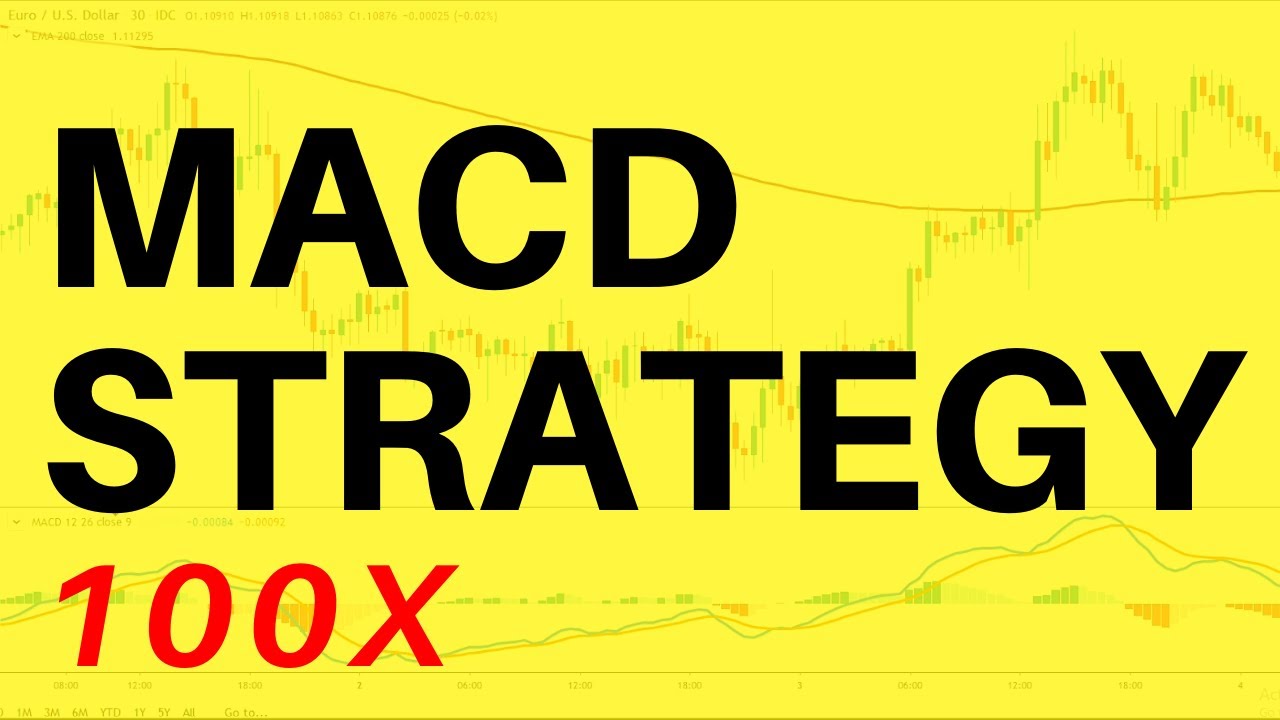
I risked MACD Trading Strategy 100 TIMES Here’s What Happened... - Forex Day Trading

Hệ Thống Scalping Trên Chart 5 Phút Của Kathy Lien - Nhật Hoài Trader

It's Impossible to Lose with THIS Strategy! It Almost Always Wins!
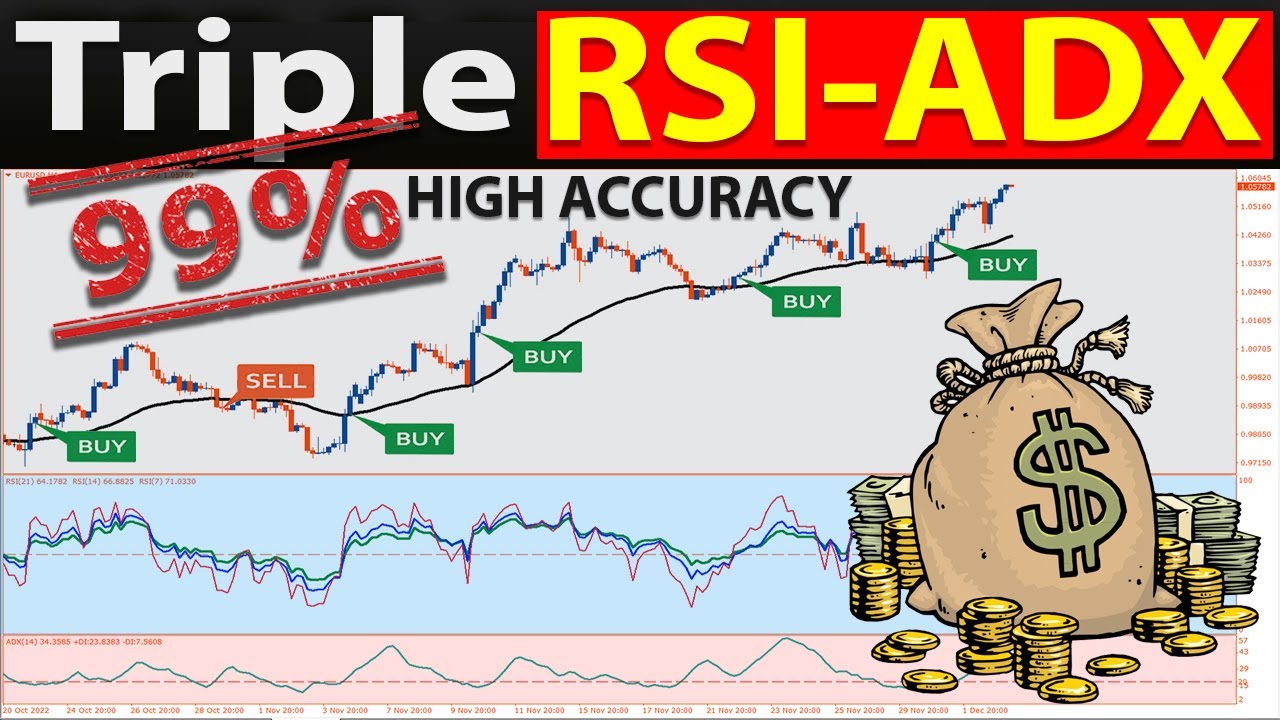
🔴 Triple RSI-ADX Trading Strategy - The BEST "SCALPING and SWING Trading Strategy" for Beginners
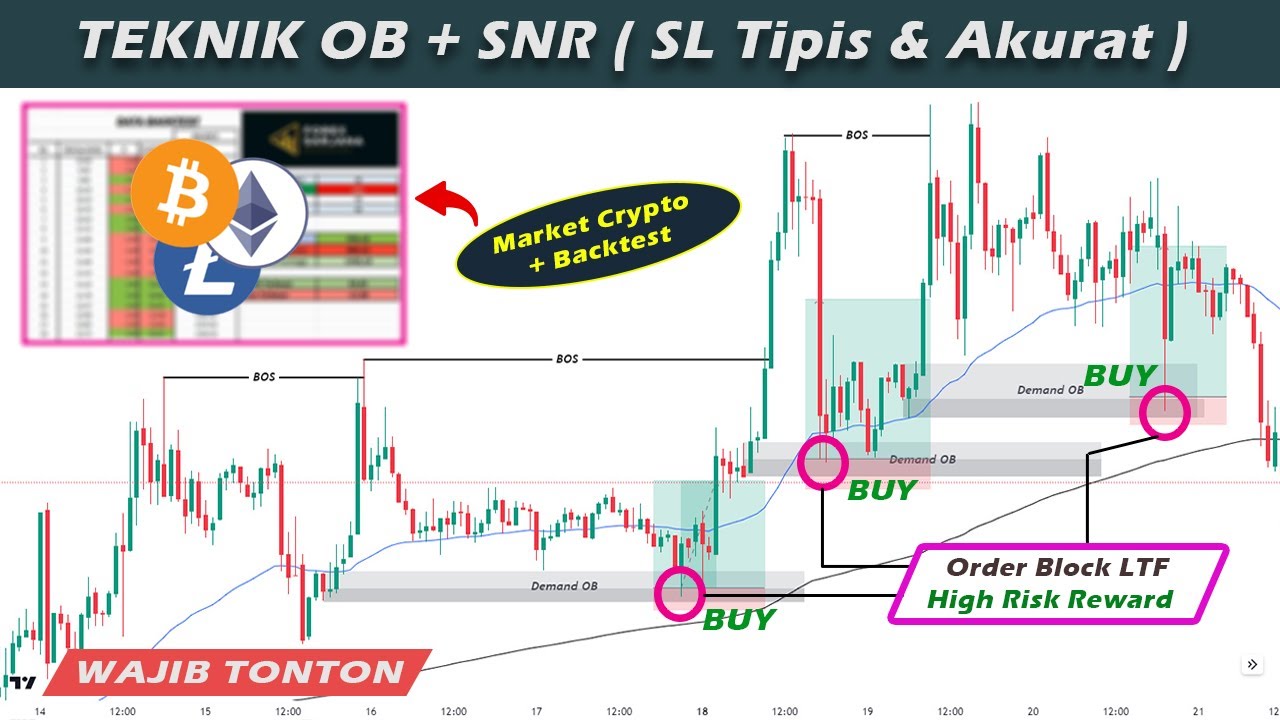
Teknik Agresif Order Block + Konfirmasi SNR || SL Tipis & Sangat Akurat || + Backtest Market Crypto
5.0 / 5 (0 votes)
