🔴 Triple RSI-ADX Trading Strategy - The BEST "SCALPING and SWING Trading Strategy" for Beginners
Summary
TLDRThis video introduces a powerful trading strategy combining the Triple RSI, ADX, and 50-period EMA indicators, designed to help traders consistently generate profits in Forex, stocks, and crypto markets. It covers key trading concepts, including how to interpret RSI lines, manage market trends, and filter out bad trades using the ADX. Practical examples and clear steps are provided to guide traders, making the strategy suitable for beginners. Additionally, the video emphasizes the importance of money management and demo trading before applying the strategy to real markets.
Takeaways
- 😀 The Triple RSI AX trading strategy combines the Triple RSI, ADX, and 50-period EMA indicators to create high-probability trading setups for Forex, stocks, and cryptocurrencies.
- 😀 The Triple RSI indicator uses three RSI lines with different periods (7, 14, and 21) to generate trade signals through crossovers between the red, blue, and green lines.
- 😀 The RSI indicator helps identify overbought and oversold conditions, with different settings affecting the frequency and reliability of trading signals.
- 😀 The 50-period Exponential Moving Average (EMA) is used to confirm the trend direction and provides key entry points when the price returns to it after a significant move away.
- 😀 The ADX indicator measures trend strength and is crucial for filtering out bad trades. A reading below 20 indicates a weak or non-existent trend, while above 20 signals a strong trend.
- 😀 The strategy suggests trading on time frames of 15 minutes or higher to get the best results and reduce market noise.
- 😀 A bullish trade setup is confirmed when the red RSI line crosses above the others, all RSI lines are above the 50 level, the price is above the EMA, and the ADX is above 20 and rising.
- 😀 A bearish trade setup occurs when the red RSI line crosses below the others, all RSI lines are below the 50 level, the price is below the EMA, and the ADX is above 20 and rising.
- 😀 Price action confirmation, such as pin bars or engulfing bars, can be used to refine entries, especially in a more conservative approach.
- 😀 The strategy emphasizes the importance of aligning the 50 EMA with horizontal support and resistance levels to filter out weaker setups and increase the likelihood of success.
Q & A
What is the Triple RSI ADX Trading Strategy?
-The Triple RSI ADX Trading Strategy is a method that combines three RSI lines (with periods of 7, 14, and 21), the 50-period EMA (Exponential Moving Average), and the ADX (Average Directional Index) to generate high-probability trading signals. It is used across different markets, including Forex, stocks, and crypto.
How does the Triple RSI indicator work?
-The Triple RSI indicator consists of three dynamic RSI lines, each with different periods (7, 14, and 21). These lines, color-coded red, blue, and green, cross over each other to generate trading opportunities. When the red line crosses above the other two, it signals a bullish trend, and vice versa for a bearish trend.
What are the key settings for the RSI indicator?
-The RSI indicator typically uses a 14-period setting, which means it calculates using the last 14 candles or bars on the price chart. Shorter time frames (like 5 periods) generate more frequent signals, while longer time frames (like 50 periods) give fewer but more reliable signals.
Why is the 14-period RSI setting considered optimal for trading?
-The 14-period RSI setting is based on research by J. Wells Wilder, who found it to be the most effective for swing trading, as it aligns with natural cycles such as the lunar cycle. It is also suitable for daily time frames and has shown to work well for analyzing market trends.
How do you combine the Triple RSI with the 50-period EMA?
-The strategy suggests observing when the price returns to the 50-period EMA after moving away from it, signaling a potential trend. Trades are executed when the price bounces off the EMA following a strong move, ideally in conjunction with horizontal support/resistance levels.
What role does the ADX indicator play in the strategy?
-The ADX indicator helps filter out bad trades by confirming the strength of the current trend. If the ADX is above 20 and moving upwards, it indicates a strong trend, making it a valid time to enter a trade. If the ADX is below 20 or moving downwards, it signals weak or diminishing trend strength, suggesting no trade.
What are the entry triggers for a bullish trade using this strategy?
-For a bullish trade, the conditions include the red RSI line crossing above the blue and green lines, all three RSI lines being above the 50 level, the price being above the 50-period EMA, and the ADX reading being above 20 and moving upwards. Once these conditions align, a buy position is opened.
What are the entry triggers for a bearish trade using this strategy?
-For a bearish trade, the conditions include the red RSI line crossing below the blue and green lines, all three RSI lines being below the 50 level, the price being below the 50-period EMA, and the ADX reading being above 20 and moving upwards. These factors indicate a potential downward trend, prompting a sell position.
How do you manage stop losses in this strategy?
-In this strategy, stop losses are placed just above or below the most recent swing high or low, with a buffer of 5-10 pips, depending on the type of trade (bullish or bearish). This helps to protect against adverse market moves while allowing for potential profit.
What is the recommended time frame for using the Triple RSI ADX strategy?
-The strategy is recommended for time frames of 15 minutes or higher. This allows for sufficient price action and trend confirmation while minimizing the noise that can occur in lower time frames.
Outlines

This section is available to paid users only. Please upgrade to access this part.
Upgrade NowMindmap

This section is available to paid users only. Please upgrade to access this part.
Upgrade NowKeywords

This section is available to paid users only. Please upgrade to access this part.
Upgrade NowHighlights

This section is available to paid users only. Please upgrade to access this part.
Upgrade NowTranscripts

This section is available to paid users only. Please upgrade to access this part.
Upgrade NowBrowse More Related Video
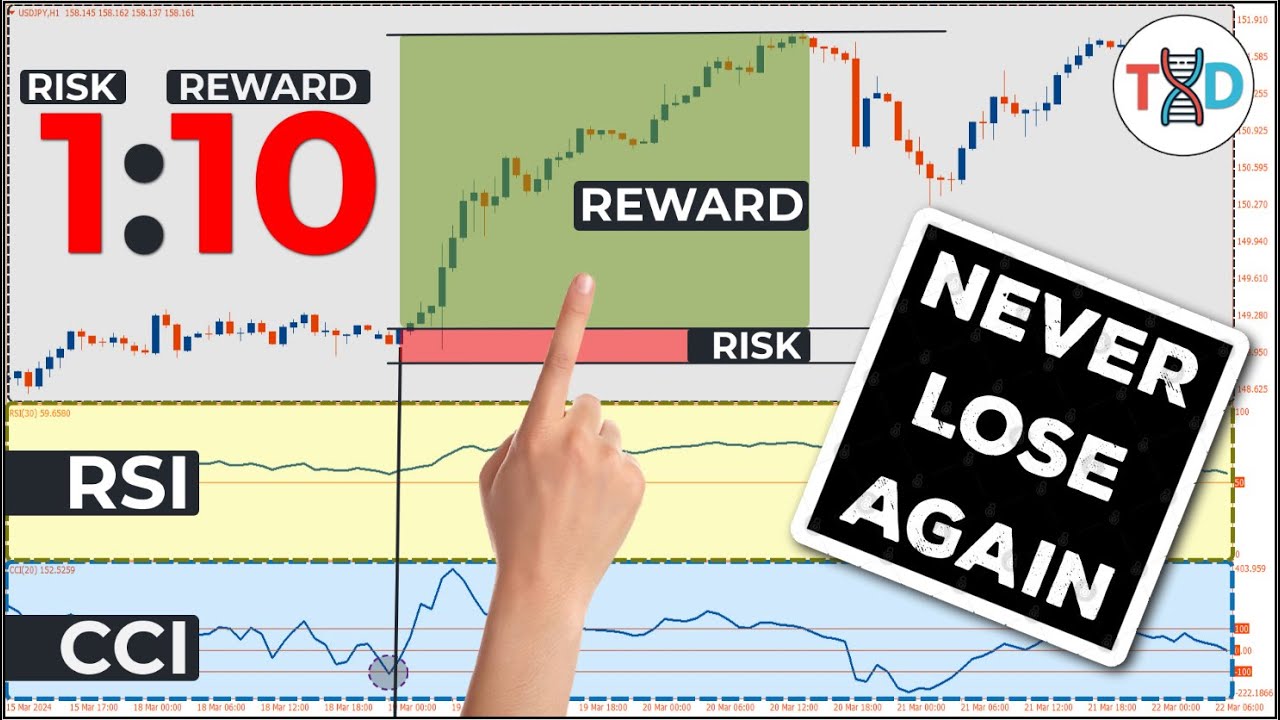
🔴 [1:10] Risk Reward Ratio RSI-CCI Trading (You'll Never Lose Again)

RAHASIA SCALPING PAKAI TF 1 MENIT, PUNYA AKURASI 80%??

🔴 (98% WINRATE STRATEGY) Combines 3 Important Tools: The MACD, Stochastic Oscillator, and RSI

🔴 (100% SNIPER Entries) - This "MACD-STOCHASTIC-RSI" Strategy Will Make You Filthy RICH
Secret Indicator Could Be Banned_100% Accuracy Hit a Level Not Seen in a Decade!

Liquidity Trading strategy - Smart money concepts
5.0 / 5 (0 votes)