Piktogram dan Diagram Batang | Matematika SD
Summary
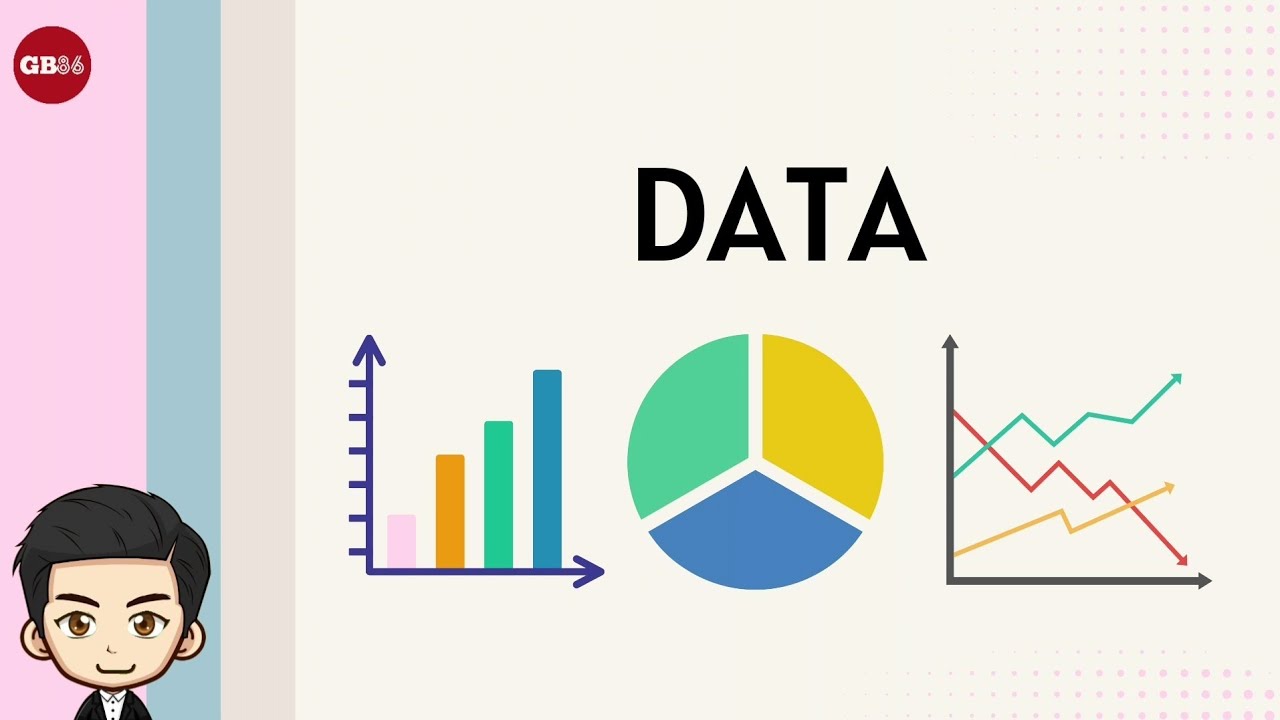
TLDRThis video explains how to read and interpret pictograms and bar charts using simple examples. It covers how pictograms use images to represent quantities, like books borrowed from a library, and how bar charts represent data with rectangular bars. Viewers will learn how to analyze these visual data representations to draw conclusions, such as identifying the most or least frequent events. The video emphasizes the importance of mastering these skills for logical thinking, data presentation, and professional fields like statistics and marketing. Viewers are encouraged to practice and share their learning experiences.
Takeaways
- 😀 Pictograms use images or symbols to represent data, where each image represents a specific quantity.
- 😀 In a pictogram, the number of images tells you the total amount of data in each category.
- 😀 For example, in a pictogram about book loans, each book image represents 10 books borrowed.
- 😀 By analyzing a pictogram, you can easily determine trends, such as which day had the highest or lowest number of books borrowed.
- 😀 A bar chart presents data using rectangular bars where the height of each bar indicates the value or quantity of the data in a category.
- 😀 Bar charts typically consist of a horizontal axis for categories and a vertical axis for values or quantities.
- 😀 In a bar chart, the taller the bar, the higher the value or quantity it represents.
- 😀 For example, in a bar chart about students' math test scores, the height of the bars shows who scored highest or lowest.
- 😀 Pictograms and bar charts make data more visually engaging and easier to understand.
- 😀 Learning to read pictograms and bar charts helps develop skills like logical thinking, attention to detail, and critical analysis.
- 😀 Mastering these concepts is important in various fields, including statistics, research, finance, business, and marketing.
Q & A
What is a piktogram and how is it used to present data?
-A piktogram, also known as a pictogram, is a way to present data using images or symbols, where each image represents a specific quantity. It is useful for visualizing information in an easy-to-understand manner, such as representing the number of books borrowed in a library.
How can we interpret a piktogram showing book loans in a library?
-To interpret a piktogram, count the images and multiply by the value each image represents. For example, if each book image represents 10 books, and there are 5 images for Friday, you can conclude that 50 books were borrowed on that day.
What is the significance of using piktograms in data representation?
-Piktograms help simplify complex data, making it visually accessible and easier to understand. They are especially useful for comparing quantities across categories and recognizing trends at a glance.
How do we calculate the total number of books borrowed in a week using a piktogram?
-To calculate the total number of books borrowed, sum the values represented by the images. For example, on Monday, there are 3 images (representing 30 books), and so on for each day. Adding all these values together gives the total number of books borrowed.
What is a bar diagram and how does it differ from a piktogram?
-A bar diagram presents data using rectangular bars, where the height of each bar indicates the value for each category. Unlike piktograms, which use images or symbols, bar diagrams represent data numerically along two axes: one for categories and one for values.
What does the vertical axis represent in a bar diagram?
-The vertical (or Y) axis in a bar diagram shows the values or quantities for each category. It allows you to compare the magnitude of different categories at a glance.
How do you interpret a bar diagram comparing student test scores?
-To interpret a bar diagram showing student test scores, look at the height of each bar. The taller the bar, the higher the test score for that student. This allows for quick comparison between students.
Why is it important to study piktograms and bar diagrams?
-Studying piktograms and bar diagrams helps develop skills in data presentation, logical thinking, and analysis. It also enables better understanding of information in everyday life, such as surveys, weather graphs, or business reports.
How can understanding bar diagrams help in real-world professions?
-Professionals in fields like statistics, research, finance, business, and marketing often use bar diagrams to present and analyze data. Understanding how to read and create them is essential for making informed decisions based on data.
What can we learn from the bar diagram showing students' Math test scores?
-From the bar diagram, we can see that the student with the highest test score is Bela, with a score of 90, while Mega has the lowest score of 70. The height of the bars clearly represents each student's performance.
Outlines

Dieser Bereich ist nur für Premium-Benutzer verfügbar. Bitte führen Sie ein Upgrade durch, um auf diesen Abschnitt zuzugreifen.
Upgrade durchführenMindmap

Dieser Bereich ist nur für Premium-Benutzer verfügbar. Bitte führen Sie ein Upgrade durch, um auf diesen Abschnitt zuzugreifen.
Upgrade durchführenKeywords

Dieser Bereich ist nur für Premium-Benutzer verfügbar. Bitte führen Sie ein Upgrade durch, um auf diesen Abschnitt zuzugreifen.
Upgrade durchführenHighlights

Dieser Bereich ist nur für Premium-Benutzer verfügbar. Bitte führen Sie ein Upgrade durch, um auf diesen Abschnitt zuzugreifen.
Upgrade durchführenTranscripts

Dieser Bereich ist nur für Premium-Benutzer verfügbar. Bitte führen Sie ein Upgrade durch, um auf diesen Abschnitt zuzugreifen.
Upgrade durchführenWeitere ähnliche Videos ansehen
Data - Materi Matematika Kelas 5 Kurikulum Merdeka

PENYAJIAN DATA DALAM BENTUK TABEL & DIAGRAM || PENGOLAHAN DATA

Data & Diagram [Part 5] - Menyajikan Data pada Diagram Batang

1 PENYAJIAN DATA - STATISTIKA - KELAS 7 SMP

Evaluasi kajian Statistika dlm masalah Kontekstual (Yunita)

Penyajian Data (Part-2) ~ Latihan Soal-Soal (Materi PJJ Kelas VII / 7 SMP)
5.0 / 5 (0 votes)
