MMXM Mentorship Episode 3: Failure Swings
Summary
TLDRThis video script delves into key concepts of trading, particularly failure swings and liquidity. It explains how failure swings, both bullish and bearish, reflect low resistance liquidity, which acts as a target for price movements. The script highlights the importance of understanding low and high resistance liquidity to identify market opportunities and how these patterns apply across different timeframes. The focus is on utilizing failure swings for accurate liquidity drawing, analyzing discount and premium levels, and confirming market direction through high resistance liquidity runs and price rejections. The video aims to guide traders in effectively using these strategies for market analysis.
Takeaways
- 😀 A failure swing occurs when a swing high fails to take out another swing high, or a swing low fails to take out another swing low.
- 😀 Bullish market conditions call for bearish failure swings (highs that fail to take out previous highs), while bearish conditions call for bullish failure swings (lows that fail to take out previous lows).
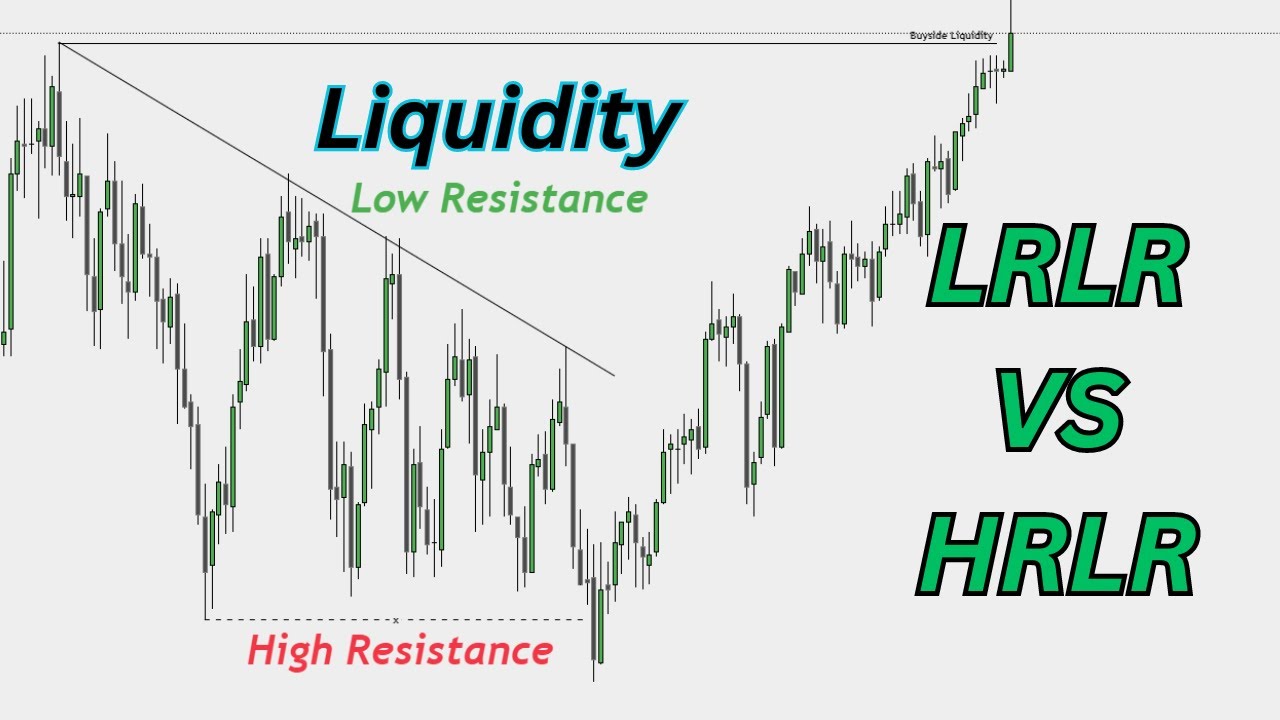
- 😀 Failure swings indicate low resistance liquidity, which is important to target in a bullish market when looking for areas to draw liquidity.
- 😀 High resistance liquidity occurs when a low takes out a previous low and rejects, or when a high takes out a previous high and rejects. These rejections indicate areas of resistance in the market.
- 😀 When the market is bullish, high resistance liquidity runs typically happen on the opposing side of the market order flow, making it harder for the market to go below these lows.
- 😀 In bearish market conditions, high resistance liquidity runs occur on the side of the structure, making it harder for the market to go above these highs.
- 😀 After reaching a discount array in a bullish market, the focus shifts to targeting low resistance liquidity, as it indicates areas where price is likely to move into premium.
- 😀 A market maker buy model depicts a scenario where liquidity is drawn from failure swings in the discount array to reach the premium levels.
- 😀 In bearish market conditions, after reaching a premium array, the focus shifts to targeting high resistance liquidity as a confirmation of bearish order flow.
- 😀 Understanding failure swings across different timeframes allows for better market prediction, as the low and high resistance liquidity dynamics remain consistent across timeframes.
Q & A
What is a failure swing in market structure?
-A failure swing is a swing high that fails to take out a previous swing high, or a swing low that fails to take out a previous swing low. These represent low-resistance liquidity areas that price often moves through easily.
Why are failure swings considered low-resistance liquidity?
-Because they represent weak liquidity levels that have not cleared prior swing points. Price tends to move through these areas with little resistance, similar to a hot knife cutting through butter.
What type of failure swing do we want to see when the market is bullish?
-In a bullish environment, we want to see bearish failure swings—highs that fail to take out previous highs. These form ideal upside liquidity targets.
What is high-resistance liquidity?
-High-resistance liquidity forms when price takes out a previous high or low and then immediately rejects, signaling strong protection of that level. These rejections occur on the side of the structure aligned with expected order flow.
How do high-resistance liquidity runs help confirm bullish order flow?
-When bullish, a low is taken out and then immediately rejected. This creates a high-resistance low, suggesting sellers failed to push lower and buyers are defending the level—confirming bullish order flow.
How are failure swings used within market maker buy models?
-In buy models, failure swings often cluster above price as engineered liquidity. Once price forms a discount low and reverses bullishly, these failure swings become targets for the draw on liquidity.
How does premium and discount context affect liquidity targeting?
-While in discount, price generally seeks to move toward premium. If failure swings lie in premium, they become ideal liquidity targets during the move toward higher prices.
How does high-resistance liquidity appear in a bearish environment?
-In bearish conditions, a previous high is taken out and then rejected. This creates a high-resistance high, suggesting buyers failed to push higher and confirming bearish order flow.
Why do markets often target clustered lows or highs?
-Clusters of equal or near-equal levels (failure swings or relative equal highs/lows) represent pools of liquidity where stop orders accumulate. Markets naturally gravitate toward these pools as draw-on-liquidity targets.
How does the script apply these concepts to EUR/USD?
-It shows EUR/USD rejecting a monthly premium fair value gap, creating high-resistance liquidity on the daily chart. This confirms bearish order flow, making clustered lows and failure swings below price ideal downside targets.
Why do low-resistance liquidity levels often get cleared in fast, impulsive moves?
-Because these levels lack structural strength—price doesn't need to fight significant opposing interest. Once momentum aligns, liquidity voids or failure swings are filled quickly.
How do premium arrays factor into choosing trade entries?
-Traders look for price to retrace into a premium array—such as a fair value gap or volume imbalance—when planning to sell. These areas provide optimal high-probability entry zones aligned with the larger liquidity draw.
Outlines

Dieser Bereich ist nur für Premium-Benutzer verfügbar. Bitte führen Sie ein Upgrade durch, um auf diesen Abschnitt zuzugreifen.
Upgrade durchführenMindmap

Dieser Bereich ist nur für Premium-Benutzer verfügbar. Bitte führen Sie ein Upgrade durch, um auf diesen Abschnitt zuzugreifen.
Upgrade durchführenKeywords

Dieser Bereich ist nur für Premium-Benutzer verfügbar. Bitte führen Sie ein Upgrade durch, um auf diesen Abschnitt zuzugreifen.
Upgrade durchführenHighlights

Dieser Bereich ist nur für Premium-Benutzer verfügbar. Bitte führen Sie ein Upgrade durch, um auf diesen Abschnitt zuzugreifen.
Upgrade durchführenTranscripts

Dieser Bereich ist nur für Premium-Benutzer verfügbar. Bitte führen Sie ein Upgrade durch, um auf diesen Abschnitt zuzugreifen.
Upgrade durchführenWeitere ähnliche Videos ansehen

How I Formed My Trading Strategy Using LRLR

How to KNOW where price will ALWAYS go - DOL simplified!

High Resistance vs Low Resistance Liquidity - ICT Concepts

ICT Mentorship Core Content - Month 03 - Institutional Market Structure
Episode 2: Low Resistance vs. High Resistance Liquidity - ICT Concepts
I Discovered Best Market Structure Analysis (Premium Video)
5.0 / 5 (0 votes)
