NVDA Stock - Crucial Level For NVIDIA
Summary
TLDRIn this Nvidia daily update, the speaker analyzes the stock's recent movements, particularly after-hours performance driven by Google’s earnings. They discuss technical factors like the 9 EMA, MACD, and key support and resistance levels around $165 and $174. While the stock's momentum appears slightly faded, the overall trend remains bullish. Short-term bearishness could be a bullish retracement, potentially leading to a higher trend. The speaker highlights key price points, emphasizing the importance of monitoring the $172–$174 range, as a breakout could unlock further upside to $180.
Takeaways
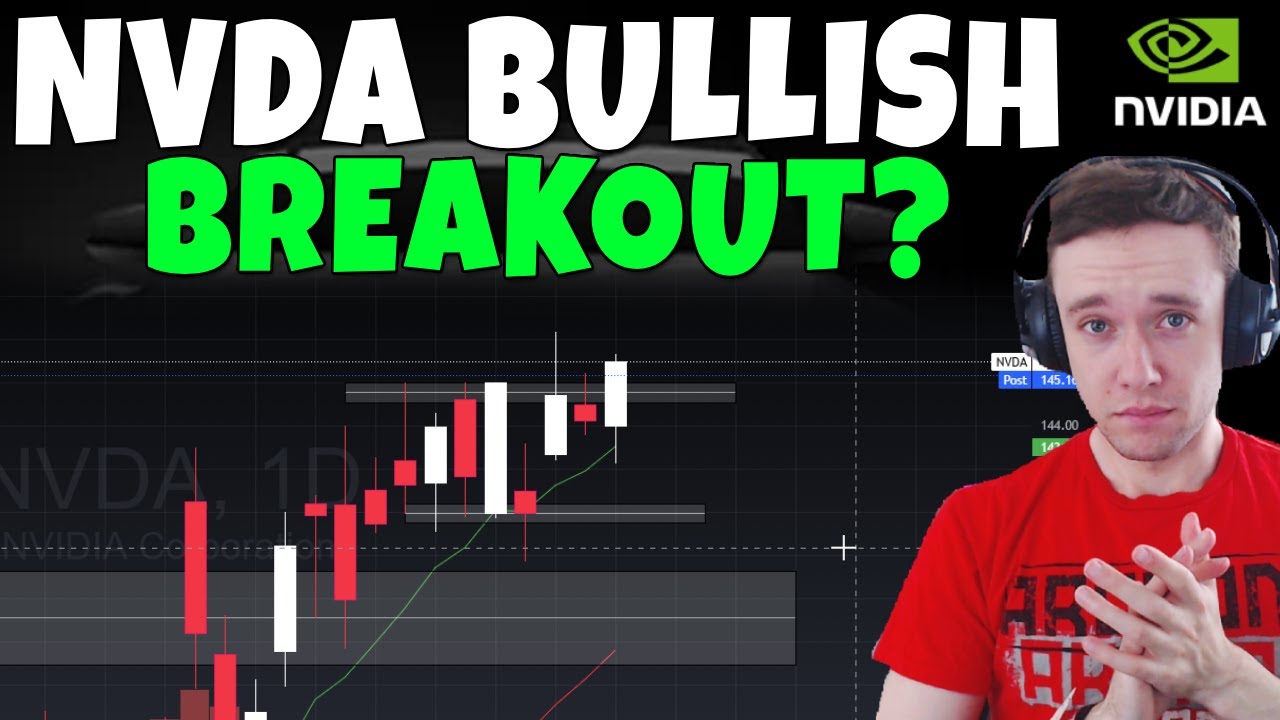
- 😀 Nvidia stock saw a 1% increase after hours, likely driven by Google's earnings report, which included a significant increase in capex spending.
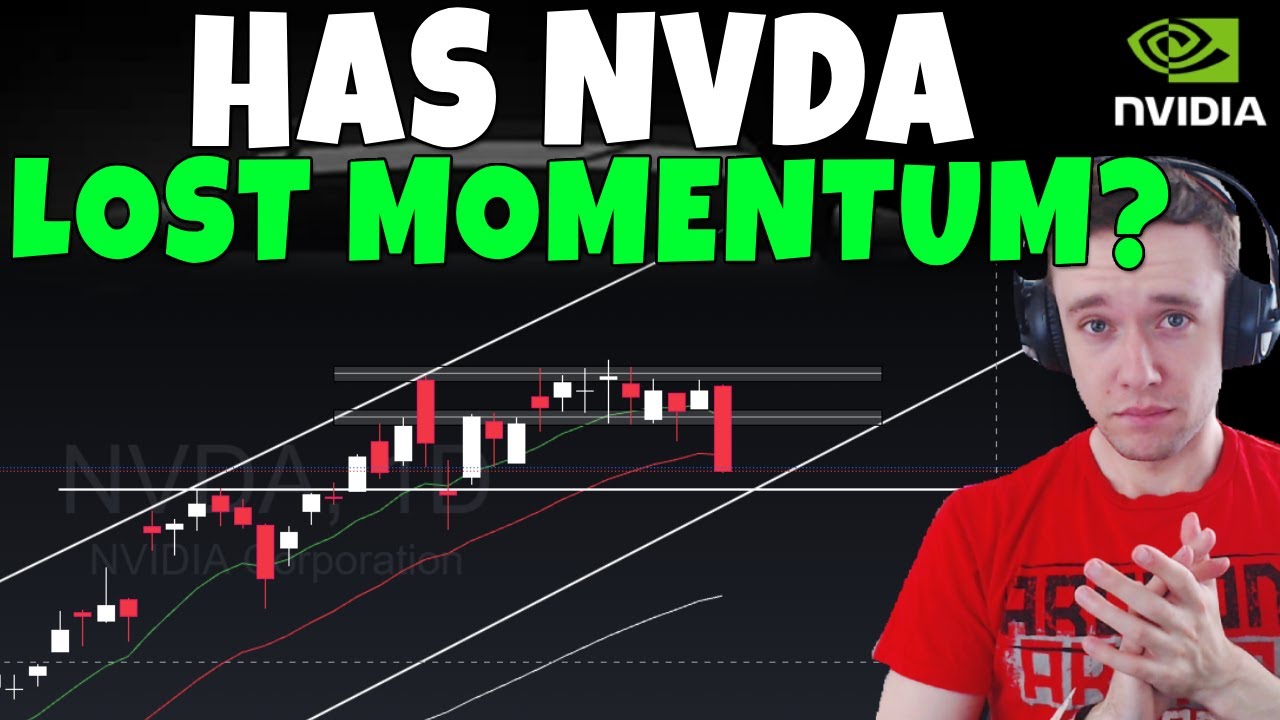
- 😀 The stock had a small red flag yesterday with a candle closing below the 9 exponential moving average, signaling potential fading momentum.
- 😀 Despite the recent red flag, the overall momentum for Nvidia remains bullish, with the stock still above key moving averages and MACD in the green.
- 😀 If Nvidia's stock loses the support at $165, it could lead to a further drop towards the 21 EMA, potentially reaching low $150s in the future.
- 😀 Short-term bearish movements in Nvidia could be viewed as a bullish retracement, not a signal for an impending crash.
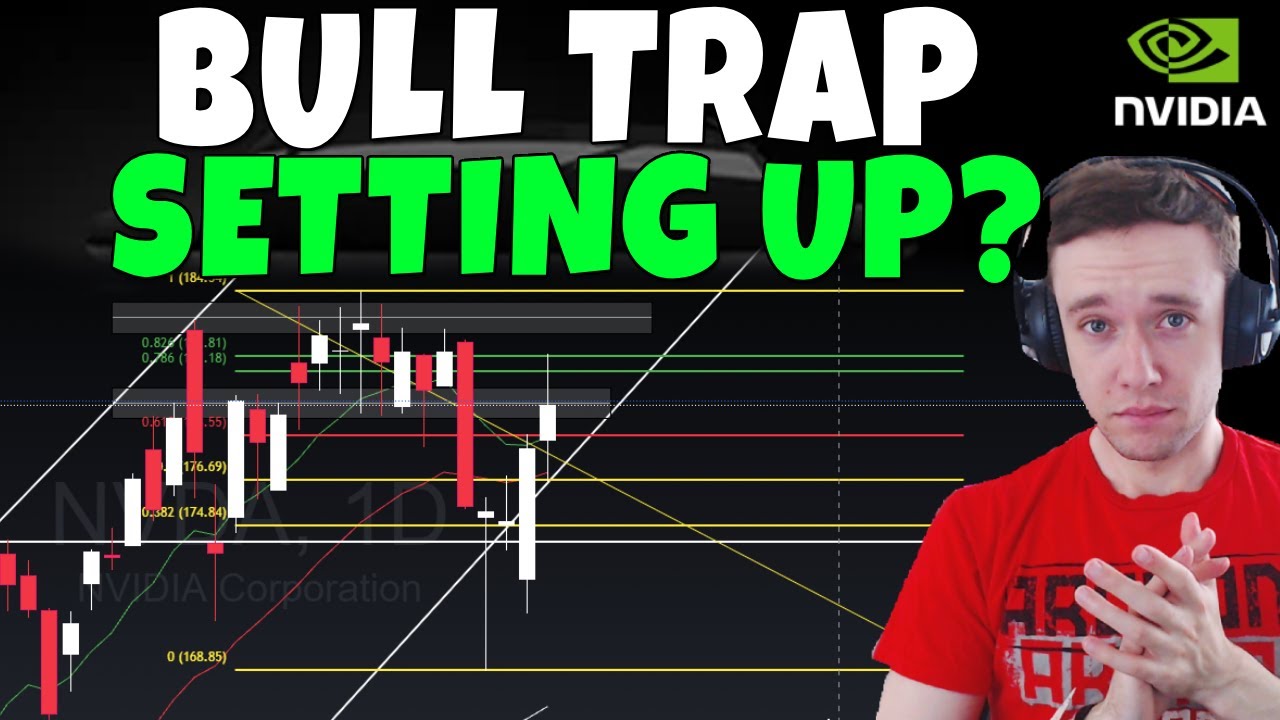
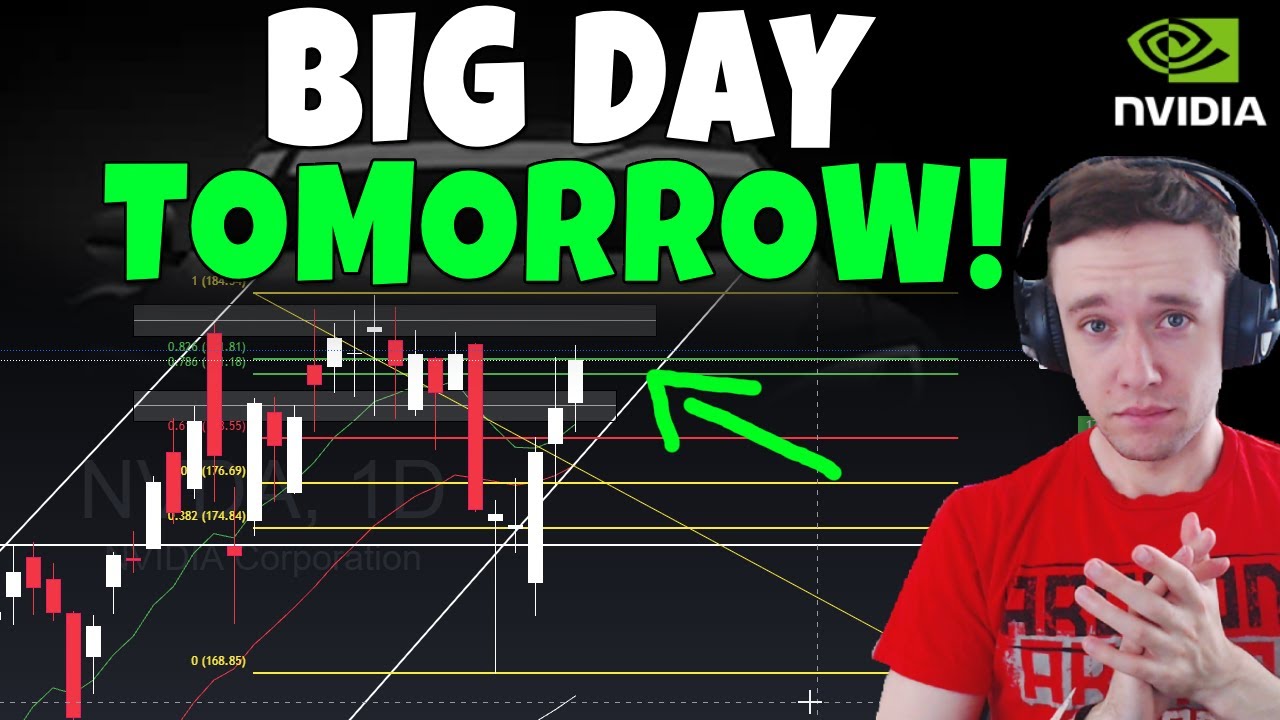
- 😀 A key resistance level for Nvidia is at $174, and if the stock reclaims this level, it could push the price towards $179-$180 per share.
- 😀 The recent 1% gap up after hours indicates potential short-term volatility and the need to monitor if the momentum continues or fades.
- 😀 There’s a possibility of a 'dead cat bounce' around the $172 resistance level, which could lead to a retest of previous lows in the short term.
- 😀 The MACD indicator shows elevated momentum, but the stock's near-term direction depends on whether the 172-173 zone holds as resistance or breaks.
- 😀 The options flow data suggests bulls are still dominating, but there is some bearish sentiment, which makes the $172 resistance level critical to watch.
- 😀 Overall, the stock is still in a strong bullish uptrend, but caution is needed in the short term as the market reacts to earnings reports and resistance levels.
Q & A
What triggered Nvidia's stock increase in after-hours trading?
-Nvidia's stock increased by 1% after hours, likely due to Google's earnings report, where Google raised its capex spending by about $10 billion, which is seen as positive news for Nvidia.
What does the recent candle closing below the 9 exponential moving average (EMA) signify?
-The candle closing below the 9 EMA for the first time in a while is a small red flag. While it doesn’t immediately imply a crash, it suggests that momentum might be fading, indicating that the stock's upward movement could be limited.
How does the MACD indicator relate to Nvidia's current stock performance?
-The MACD (Moving Average Convergence Divergence) is elevated, indicating strong momentum. However, if the MACD starts to turn red, it would confirm that momentum has faded. Despite this, a false breakdown similar to previous instances might occur, where the stock could still go higher.
What happens if Nvidia's stock price drops below $165?
-If Nvidia’s stock drops below $165, it would be a red flag, as it would signal a breakdown of both a support level and the 21 EMA. This could lead to a further decline, potentially reaching the low 150s.
How can a short-term bearish trend affect Nvidia’s stock in the long term?
-Short-term bearish trends, like retracements, can actually create bullish situations in the longer term. This is because such trends might be part of a larger bullish pattern, where the stock ultimately rebounds and moves higher.
What resistance level should investors watch for an upward breakout in Nvidia’s stock?
-The key resistance level to watch is around $174. If Nvidia can break above this level and turn it into support, the stock could move towards $179–$180.
What is a potential risk if Nvidia's stock fails to maintain the $172 resistance zone?
-If Nvidia’s stock struggles to stay above the $172 resistance zone, it could lead to a dead cat bounce, where the stock falls back to retest lower levels, possibly around the $165 support zone.
How does the Fibonacci retracement level influence Nvidia’s stock movement?
-The Fibonacci retracement levels provide key support and resistance zones. A resistance zone near $172 could indicate a potential dead cat bounce, while reclaiming levels above $174 could lead to further upside potential toward $179–$180.
What are the implications of Nvidia’s current bullish momentum despite some short-term bearish signals?
-Despite some short-term bearish signals, Nvidia’s overall momentum remains bullish. The stock is still above important moving averages, and while a short-term retracement could occur, the long-term trend remains positive, with potential for further growth.
What role does options flow play in Nvidia's stock outlook?
-Options flow shows that the bulls are dominating, with a significant call option for $175 expiring on August 15th. This suggests that investors are betting on continued upward movement for Nvidia, reinforcing the overall bullish sentiment.
Outlines

Dieser Bereich ist nur für Premium-Benutzer verfügbar. Bitte führen Sie ein Upgrade durch, um auf diesen Abschnitt zuzugreifen.
Upgrade durchführenMindmap

Dieser Bereich ist nur für Premium-Benutzer verfügbar. Bitte führen Sie ein Upgrade durch, um auf diesen Abschnitt zuzugreifen.
Upgrade durchführenKeywords

Dieser Bereich ist nur für Premium-Benutzer verfügbar. Bitte führen Sie ein Upgrade durch, um auf diesen Abschnitt zuzugreifen.
Upgrade durchführenHighlights

Dieser Bereich ist nur für Premium-Benutzer verfügbar. Bitte führen Sie ein Upgrade durch, um auf diesen Abschnitt zuzugreifen.
Upgrade durchführenTranscripts

Dieser Bereich ist nur für Premium-Benutzer verfügbar. Bitte führen Sie ein Upgrade durch, um auf diesen Abschnitt zuzugreifen.
Upgrade durchführen

5.0 / 5 (0 votes)
