Uji Hipotesis part 2 (Prosedur Pengujian Hipotesis, Statistik Uji, Wilayah Tolak/ Kritis)
Summary
TLDRThis lecture transcript delves into hypothesis testing in statistics, outlining the procedure involving the determination of null and alternative hypotheses, significance level, and test statistic calculation. It explains the use of Z-test statistics for large sample size and unknown population variance, demonstrating the formula and decision-making process based on critical regions and p-values. The transcript also covers one-tailed and two-tailed tests, highlighting the decision to reject the null hypothesis based on the test's direction and p-value comparison with the significance level.
Takeaways
- 📚 The lecture continues the discussion on hypothesis testing, focusing on four main points: the testing procedure, the test statistic, the critical region, and decision-making based on the hypothesis.
- 🔍 The first step in hypothesis testing is to define the null hypothesis (H0) and the alternative hypothesis (Ha).
- 📈 The significance level, or alpha (α), is determined, which is the probability of rejecting the null hypothesis when it is true.
- 📊 The test statistic is calculated, which is a function of the random variable used in the hypothesis test.
- ⚖️ The critical region or rejection region is determined, which is the range of values for the test statistic that leads to the rejection of the null hypothesis.
- 🧐 The decision to reject or not reject the null hypothesis is made based on whether the calculated test statistic falls within the critical region.
- 📉 For a one-tailed left hypothesis test, the critical region is to the left, and the decision to reject H0 is made if the test statistic is less than the critical value.
- 📈 For a one-tailed right hypothesis test, the critical region is to the right, and H0 is rejected if the test statistic is greater than the critical value.
- 🔢 The p-value is used to make decisions in hypothesis testing, representing the probability of observing a test statistic as extreme or more extreme than the one calculated, assuming the null hypothesis is true.
- 🔄 For a two-tailed hypothesis test, the critical region is split into two tails, one on each side of the distribution, and H0 is rejected if the test statistic falls in either tail.
- 📚 The lecture also mentions different types of test statistics such as Z-test, t-test, F-test, and chi-square test, each used depending on the hypothesis about the parameter being tested.
Q & A
What are the four main topics covered in this lecture about hypothesis testing?
-The four main topics covered are the procedure of hypothesis testing, test statistics, critical region, and decision-making from the hypothesis.
What is the first step in the procedure of hypothesis testing?
-The first step is to determine the null hypothesis (H0) and the alternative hypothesis (Ha).
How is the significance level (alpha) used in hypothesis testing?
-The significance level (alpha) is used to determine the critical region where the null hypothesis will be rejected.
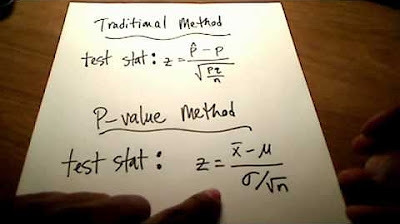
What is the formula for the Z-test statistic when the population variance is unknown?
-The Z-test statistic is calculated using the formula: (x̄ - μ0) / (s / √n), where x̄ is the sample mean, μ0 is the null hypothesis mean, s is the sample standard deviation, and n is the sample size.
What are some examples of different test statistics used in hypothesis testing?
-Examples of different test statistics include Z-test, t-test, F-test, and chi-square test.
How is the critical region for a left-tailed test determined?
-For a left-tailed test, the critical region is on the left side of the distribution and is determined by the significance level alpha, with the critical value found from the Z-table.
What decision is made if the Z-test statistic falls within the critical region?
-If the Z-test statistic falls within the critical region, the null hypothesis (H0) is rejected.
What does a p-value represent in hypothesis testing?
-The p-value represents the probability of obtaining a test statistic at least as extreme as the one observed, under the assumption that the null hypothesis is true.
How do you interpret a p-value less than the significance level alpha?
-If the p-value is less than the significance level alpha, the null hypothesis (H0) is rejected.
What is the difference between a one-tailed and a two-tailed test in hypothesis testing?
-A one-tailed test has the critical region on one side of the distribution, either left or right, while a two-tailed test has the critical region divided between both sides of the distribution.
Outlines

Dieser Bereich ist nur für Premium-Benutzer verfügbar. Bitte führen Sie ein Upgrade durch, um auf diesen Abschnitt zuzugreifen.
Upgrade durchführenMindmap

Dieser Bereich ist nur für Premium-Benutzer verfügbar. Bitte führen Sie ein Upgrade durch, um auf diesen Abschnitt zuzugreifen.
Upgrade durchführenKeywords

Dieser Bereich ist nur für Premium-Benutzer verfügbar. Bitte führen Sie ein Upgrade durch, um auf diesen Abschnitt zuzugreifen.
Upgrade durchführenHighlights

Dieser Bereich ist nur für Premium-Benutzer verfügbar. Bitte führen Sie ein Upgrade durch, um auf diesen Abschnitt zuzugreifen.
Upgrade durchführenTranscripts

Dieser Bereich ist nur für Premium-Benutzer verfügbar. Bitte führen Sie ein Upgrade durch, um auf diesen Abschnitt zuzugreifen.
Upgrade durchführenWeitere ähnliche Videos ansehen
5.0 / 5 (0 votes)


