03 Kubernetes Monitoring dan Alerting
Summary
TLDRIn this tutorial, the process of setting up Kubernetes for monitoring and alerting is demonstrated. The guide walks through the installation of essential tools like KBC, Mini Cube, Docker, Helm, and Prometheus, followed by the deployment of monitoring components including Grafana and Alert Manager. The tutorial covers creating service monitors, configuring custom alerts, and importing Grafana dashboards for real-time data visualization. Throughout the session, the importance of proper configuration and using namespaces is emphasized to ensure an efficient monitoring setup for Kubernetes applications.
Takeaways
- 😀 The case study focuses on Kubernetes-based monitoring and alerting, with similarities to Docker monitoring.
- 😀 The setup begins with installing KBC and MiniKube, followed by waiting for each process to finish.
- 😀 Docker is installed as the delivery tool, and the script includes steps for adding a user to Docker.
- 😀 The MiniKube environment is configured with custom CPU and memory settings based on the available resources.
- 😀 Verification of the MiniKube setup is performed using `kubectl get nodes` to confirm everything is working.
- 😀 Helm and its repository are installed and updated to deploy monitoring tools like Prometheus and Grafana.
- 😀 A namespace called 'monitoring' is created for deploying Prometheus, Grafana, and Alert Manager.
- 😀 Prometheus, Grafana, and Alert Manager are deployed using `kubectl` commands, and their UIs are accessed after setup.
- 😀 Grafana requires a password to log in, which can be retrieved through specific commands in the terminal.
- 😀 A service monitor is created for the application, and Prometheus rules are added for custom alerting configurations.
- 😀 The Grafana dashboard is customized by importing a pre-built dashboard from the Grafana repository to improve system monitoring.
Q & A
What is the main objective of this case study?
-The main objective is to set up monitoring and alerting in a Kubernetes environment, similar to Docker monitoring, but implemented in Kubernetes using tools like Prometheus and Grafana.
What tools are being installed in this case study?
-The tools being installed include Kubernetes (with MiniKube), Docker, Helm, Prometheus, Grafana, and AlertManager.
Why is the user installing Docker in this case study?
-Docker is installed to serve as the delivery mechanism for various services, allowing the deployment and management of containers within the Kubernetes environment.
What is the purpose of MiniKube in this setup?
-MiniKube is used to create a local Kubernetes cluster, providing a way to simulate a Kubernetes environment on a smaller scale for development and testing purposes.
What is the significance of using namespaces in Kubernetes as mentioned in the script?
-Namespaces are used to organize and separate resources in Kubernetes. This approach helps maintain clarity, particularly when deploying multiple services or applications in a shared environment.
What is Helm and why is it being installed?
-Helm is a package manager for Kubernetes. It is installed to help deploy and manage Kubernetes applications more efficiently, by managing the configuration and installation of various services.
What are the steps for deploying Prometheus, Grafana, and AlertManager?
-The user deploys Prometheus, Grafana, and AlertManager by using a Helm chart in Kubernetes, creating a specific namespace for monitoring, and running the relevant Helm commands to install and configure the tools.
What is the default login method for Grafana, and what is the solution when it doesn't work?
-The default login method for Grafana is usually 'admin' for both the username and password. However, when this does not work, the script shows how to retrieve the password by running specific commands to get it from the Kubernetes environment.
How do you create a custom alert in Prometheus as per the script?
-A custom alert is created by writing a Prometheus Rule, saving it, and applying it with the `kubectl apply` command. This rule is then used to trigger alerts based on predefined conditions.
What is the process for importing a new Grafana dashboard?
-To import a new Grafana dashboard, the user searches for a dashboard ID (such as 'Kubernetes'), copies it, and then imports it using Grafana's dashboard import feature. Once the dashboard is imported, the user can select the desired time range for metrics.
Outlines

Dieser Bereich ist nur für Premium-Benutzer verfügbar. Bitte führen Sie ein Upgrade durch, um auf diesen Abschnitt zuzugreifen.
Upgrade durchführenMindmap

Dieser Bereich ist nur für Premium-Benutzer verfügbar. Bitte führen Sie ein Upgrade durch, um auf diesen Abschnitt zuzugreifen.
Upgrade durchführenKeywords

Dieser Bereich ist nur für Premium-Benutzer verfügbar. Bitte führen Sie ein Upgrade durch, um auf diesen Abschnitt zuzugreifen.
Upgrade durchführenHighlights

Dieser Bereich ist nur für Premium-Benutzer verfügbar. Bitte führen Sie ein Upgrade durch, um auf diesen Abschnitt zuzugreifen.
Upgrade durchführenTranscripts

Dieser Bereich ist nur für Premium-Benutzer verfügbar. Bitte führen Sie ein Upgrade durch, um auf diesen Abschnitt zuzugreifen.
Upgrade durchführenWeitere ähnliche Videos ansehen

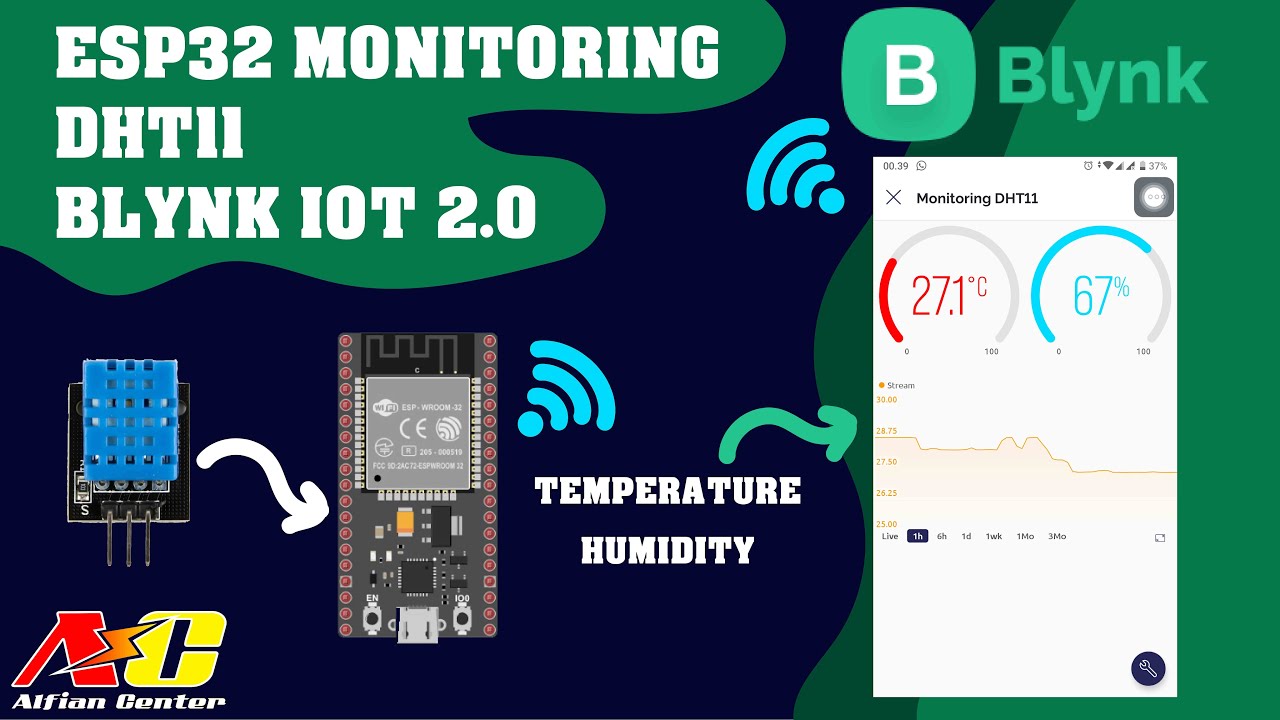
Monitoring Data Suhu dan Kelembapan Sensor DHT11 Menggunakan ESP32 dan BLYNK IOT 2.0

Datadog 101 Course | Datadog Tutorial for Beginners | SRE | DevOps

How Prometheus Monitoring works | Prometheus Architecture explained

Setup alerts in Grafana 10 with example

you need to learn Kubernetes RIGHT NOW!!

Create AWS EKS Cluster using Terraform: AWS EKS Kubernetes Tutorial - Part 2
5.0 / 5 (0 votes)
