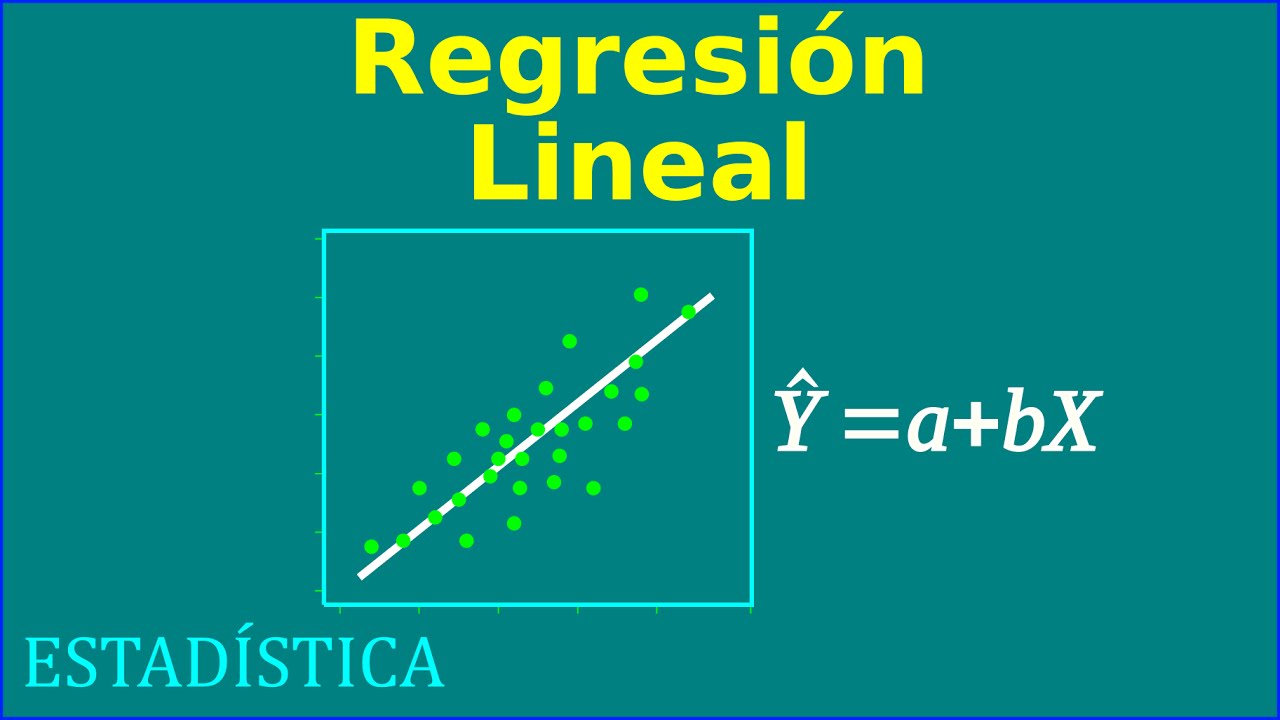
La régression linéaire, quelques explications
Summary
TLDRThis video explains how to apply a linear regression trendline to a scatter plot in Excel, using the method of least squares. It covers the mathematical principle behind finding the best-fit line by minimizing squared residuals, demonstrates how Excel calculates the line’s slope and y-intercept, and highlights how to use this line for interpolation and extrapolation. The video also introduces the coefficient of linear correlation, which quantifies the strength of the relationship between variables. Key warnings about correlation not implying causation are discussed, along with Excel functions to calculate the correlation coefficient and regression line parameters.
Takeaways
- 😀 The 'least squares criterion' is used by Excel to determine the best-fit linear regression line on a scatter plot.
- 😀 Excel calculates the regression line by minimizing the sum of squared residuals, which are the vertical distances between data points and the line.
- 😀 A regression line can be used for both interpolation (predicting values within the existing data range) and extrapolation (predicting values outside the existing data range).
- 😀 The formula for the regression line is derived by minimizing the sum of the squared residuals, a concept that mathematically guarantees the best fit.
- 😀 Excel offers functions like 'SLOPE' and 'INTERCEPT' to quickly calculate the slope and intercept of the regression line without needing complex manual calculations.
- 😀 A regression line may not always be a good model for the data if the points are not aligned well. This is assessed using the 'coefficient of determination' (R²).
- 😀 The coefficient of correlation (R) measures the linear relationship between two variables, with values ranging from -1 to 1. A value near 1 indicates a strong positive correlation.
- 😀 The coefficient of determination (R²) is the square of the correlation coefficient and represents the proportion of the variance in the dependent variable explained by the independent variable.
- 😀 The correlation coefficient can be calculated in Excel using the 'CORREL' function, which requires the X and Y data as arguments.
- 😀 It’s important to note that correlation does not imply causation—just because two variables are correlated does not mean one causes the other. External factors may influence both.
Q & A
What is a trendline in Excel?
-A trendline in Excel is a line that represents the general direction or trend of data points in a scatter plot or Cartesian chart. It can be linear (also called a regression line) or of other types like exponential, logarithmic, etc.
How does Excel determine the best-fitting trendline?
-Excel determines the best-fitting trendline using the least squares criterion, which minimizes the sum of the squared differences (residuals) between the actual data points and the points predicted by the trendline.
What does the term 'least squares criterion' refer to?
-The least squares criterion refers to a mathematical approach used to find the best-fitting line by minimizing the sum of the squares of the residuals (the vertical distances between the actual data points and the predicted values on the trendline).
What are residuals in the context of a trendline?
-Residuals are the vertical distances between each actual data point and the corresponding point on the candidate trendline. These distances are squared to ensure that both positive and negative deviations contribute positively to the sum.
Why is it important to minimize the sum of squared residuals?
-Minimizing the sum of squared residuals ensures that the trendline is as close as possible to all the data points, providing the best representation of the underlying relationship in the data.
What is the coefficient of determination (R²)?
-The coefficient of determination (R²) measures the proportion of variance in the dependent variable that is predictable from the independent variable. It indicates how well the trendline fits the data, with values closer to 1 showing a better fit.
What does a coefficient of determination (R²) close to 1 indicate?
-An R² value close to 1 indicates a strong correlation and that the trendline fits the data points very well, with a higher proportion of variability in the data being explained by the trendline.
How can the trendline be used for interpolation and extrapolation?
-The trendline can be used for interpolation by predicting values of the dependent variable (y) within the range of the existing data, and for extrapolation by predicting values of y for x-values outside the original data range.
What is the relationship between correlation and causation?
-Correlation does not imply causation. Just because two variables are correlated, it does not mean one causes the other. There could be other hidden factors influencing the relationship.
How does Excel calculate the linear correlation coefficient?
-Excel calculates the linear correlation coefficient using the function CORREL, which returns the strength and direction of a linear relationship between two variables. The result is a value between -1 and 1, where 1 indicates perfect positive correlation, -1 indicates perfect negative correlation, and 0 indicates no correlation.
Outlines

Dieser Bereich ist nur für Premium-Benutzer verfügbar. Bitte führen Sie ein Upgrade durch, um auf diesen Abschnitt zuzugreifen.
Upgrade durchführenMindmap

Dieser Bereich ist nur für Premium-Benutzer verfügbar. Bitte führen Sie ein Upgrade durch, um auf diesen Abschnitt zuzugreifen.
Upgrade durchführenKeywords

Dieser Bereich ist nur für Premium-Benutzer verfügbar. Bitte führen Sie ein Upgrade durch, um auf diesen Abschnitt zuzugreifen.
Upgrade durchführenHighlights

Dieser Bereich ist nur für Premium-Benutzer verfügbar. Bitte führen Sie ein Upgrade durch, um auf diesen Abschnitt zuzugreifen.
Upgrade durchführenTranscripts

Dieser Bereich ist nur für Premium-Benutzer verfügbar. Bitte führen Sie ein Upgrade durch, um auf diesen Abschnitt zuzugreifen.
Upgrade durchführenWeitere ähnliche Videos ansehen
Regresion Lineal
Metode Kuadrat Terkecil Hal 97-101 Bab 3 STATISTIK Kelas 11 SMA Kurikulum Merdeka

Metode Numerik Pertemuan Regresi Linier

Metode Statistika | Analisis Regresi Linier | Part 1 Menentukan Persamaan Regresi

REGRESSION AND CORRELATION EDDIE SEVA SEE

Regresi Linear Sederhana dengan Ordinary Least Square
5.0 / 5 (0 votes)
