Episode 9: Using Standard Deviations Day Trading - ICT Concepts
Summary
TLDRThis trading tutorial explores the use of standard deviations for setting price targets and identifying potential accumulation or reversal phases in the market. The video demonstrates how to apply these tools on various time frames, from intraday charts to daily charts, using specific settings and Fibonacci tools to measure market manipulation and project price movements. It provides practical examples on the NASDAQ charts, illustrating how to frame trades and anticipate reversals or continuations based on standard deviation levels.
Takeaways
- 📊 Standard Deviations are used in trading to determine price targets and to identify potential retracements or reversals in the market.
- 📈 Traders can take partial or full positions off at standard deviations, which can help in managing risk and profit-taking.
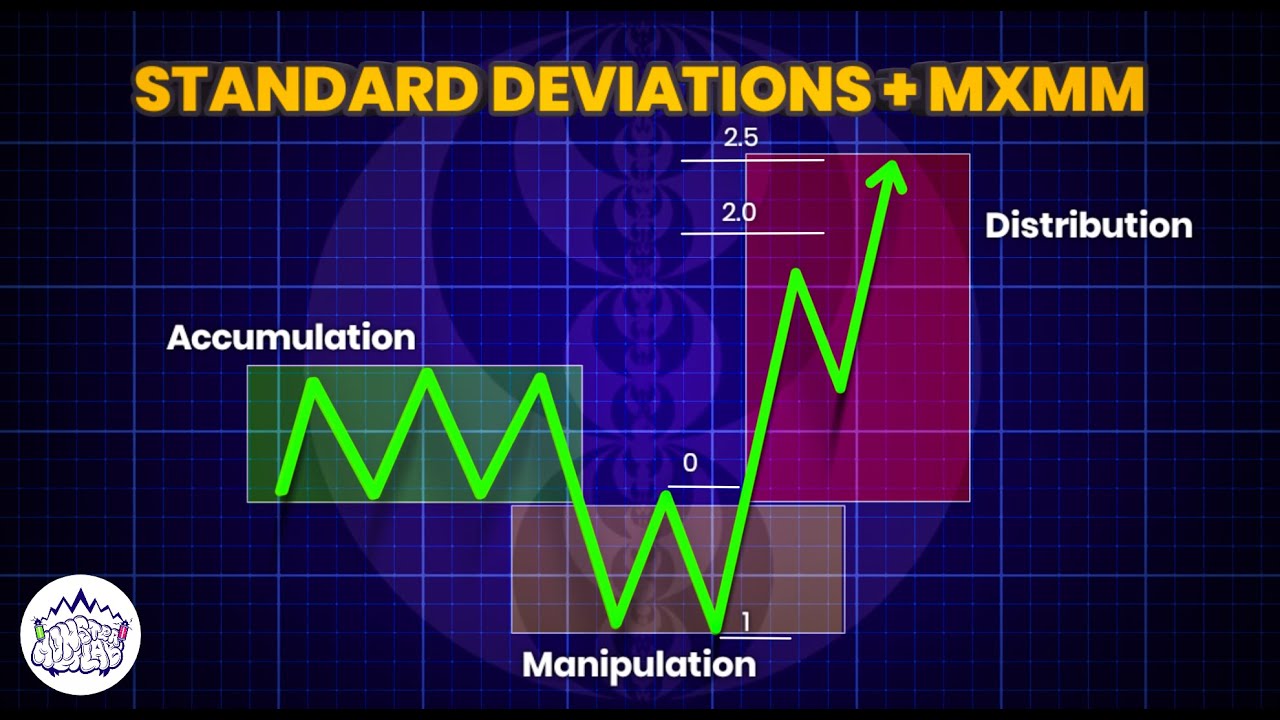
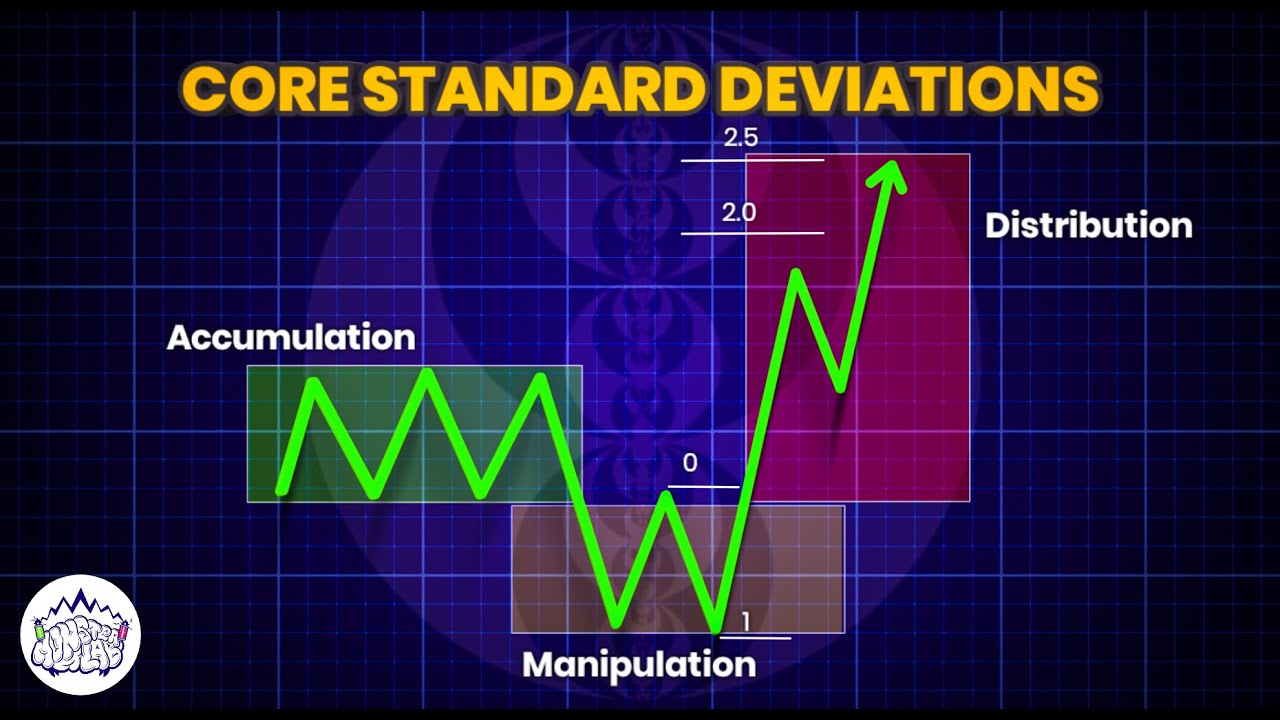
- 🔍 The script emphasizes the importance of identifying accumulation phases and manipulation legs in the market for better trade setups.
- 📐 The Fibonacci tool with standard deviation settings is used to measure market movements and project potential price levels.
- 🎛️ Accumulation phases are framed between 0.5 to -1 standard deviations, which can indicate a potential buying opportunity.
- 🔄 Retracements or reversals are often framed at -2 to -2.5 standard deviations, aligning with liquidity levels and potential price reactions.
- 📉 Expansions lower in the market can be measured from the low to the high of the standard deviation range, providing targets for short positions.
- 🚫 At -4 standard deviations, the market is more likely to experience a full reversal rather than a continuation, cautioning traders against continuation trades.
- 📝 The script provides practical examples on various time frames, from daily to minute charts, demonstrating the fractal nature of price action.
- 📉 The -2.5 standard deviation level is highlighted as a critical point where the market often respects this level before reversing or continuing lower.
- 📈 Equilibrium levels are identified as potential price targets for long positions, especially after a market has shown respect for certain standard deviation levels.
Q & A
What is the purpose of standard deviations in trading?
-Standard deviations are used for setting price targets in trading. They help traders to determine points at which they can take partial or full positions off and are used to frame retracements or reversals in the market.
How do standard deviations relate to accumulation and expansion phases in trading?
-When traders accumulate at a standard deviation level, they can expect an accumulation phase to follow, which may then lead into an expansion phase. This is a way to identify potential market movements based on standard deviation levels.
What settings does the speaker recommend for using standard deviations in trading?
-The speaker does not specify exact numerical settings for standard deviations, emphasizing that the numbers are not as important as the visual framing. However, they do mention that the visual indicators such as checks and numbers should be present and can be customized to any preferred color.
What is the significance of the manipulation leg in identifying standard deviations?
-The manipulation leg is significant because it represents a high to a new low, which traders use to measure the standard deviations. This measurement helps in identifying potential accumulation phases and subsequent market movements.
How are standard deviations used to identify accumulation phases on intraday charts?
-Standard deviations can be used to identify accumulation phases by measuring from the high to the low during a manipulation phase. The levels of 0.5 to -1 are often where traders can frame an accumulation phase from, as seen in the script with the example of a run on stops and continuation to -2 and -2.5.
What is the role of the -2.5 standard deviation level in framing reversals or retracements?
-The -2.5 standard deviation level is where the price often reverses or retraces because it typically aligns with sell-side or buy-side liquidity. It is a critical level to watch for potential market reversals.
How can the entire range of a standard deviation be measured for a potential price target?
-To measure the entire range for a potential price target, traders measure from the low that the standard deviation was measured from to the high that this low made. This range helps in identifying equilibrium, which can be a target for trades.
Why is the -4 standard deviation level significant for potential reversals?
-The -4 standard deviation level is significant because it is often where the price stops and either accumulates or has a full-on reversal. It is a level at which traders should be cautious about framing continuation trades, as reversals are most likely to happen here.
Can the principles of standard deviations be applied to different time frames?
-Yes, the principles of standard deviations can be applied to different time frames, as price action is fractal and works on all time frames, from intraday charts to daily charts.
What is the practical application of standard deviations in identifying entry and exit points for trades?
-Practically, standard deviations help traders identify entry and exit points by measuring from significant highs or lows during market manipulation phases. The levels of standard deviations project potential accumulation, distribution, and reversal points, which can be used to frame trades.
Outlines
📈 Understanding Standard Deviations in Trading
This paragraph introduces the concept of standard deviations in trading, emphasizing their use for setting price targets and identifying potential points for taking partial or full positions. It explains how standard deviations can frame retracements or reversals and how they are integral to the accumulation and expansion phases of market movements. The speaker provides personal settings for visualizing standard deviations on trading charts, including the importance of including checks and numbers for accurate measurement. The paragraph concludes with an example of how to apply these settings to identify accumulation phases and potential reversal points on intraday charts.
📊 Applying Standard Deviations to Chart Analysis
The second paragraph delves deeper into applying standard deviations to chart analysis, illustrating how to measure manipulation phases and project standard deviations from highs and lows. It discusses the significance of the -2 to -2.5 range as a common reversal point and explains how to measure the entire range for potential price targets. The speaker uses the NASDAQ hourly and daily charts to demonstrate how to frame accumulation phases and reversals, highlighting the importance of respecting certain standard deviation levels and how they can indicate potential price targets. The paragraph also touches on the concept of equilibrium as a target for framing long positions and the importance of time frames in trading analysis.
📉 Intraday Trading with Standard Deviations
This paragraph focuses on the application of standard deviations in intraday trading, showing how they can be used to identify accumulation and distribution phases within short time frames. The speaker provides examples from the NASDAQ 15-minute and 5-minute charts, demonstrating how to measure from highs to lows and apply standard deviations to predict reversals and continuations. The importance of liquidity alignment and the ease of measuring standard deviations on intraday charts are highlighted. The paragraph concludes with an example from a one-minute chart, reinforcing the concept that price action is fractal and the same principles apply regardless of the time of day.
Mindmap
Keywords
💡Standard Deviation
💡Price Target
💡Accumulation Phase
💡Retracement
💡Reversal
💡Manipulation Leg
💡Expansion
💡Intraday Charts
💡Liquidity
💡Equilibrium
💡Fractal
Highlights
Standard deviations are used for setting price targets and managing trading positions.
Traders can use standard deviations to frame retracements or reversals in the market.
Accumulation at standard deviations can lead to an expansion phase in the market.
The presenter shares personal settings for using standard deviations in trading.
Standard deviation lines and numbers are crucial for identifying market phases.
The concept of a 'manipulation leg' is introduced as part of market analysis.
Traders can measure market manipulation using the standard deviation FIB tool.
The -2 to -2.5 standard deviation range is significant for potential price reversals.
Intraday charts are useful for identifying accumulation phases using standard deviations.
The equilibrium range can be measured for potential price targets in trading.
The -4 standard deviation level is often a point of interest for potential reversals.
Examples are provided using the NASDAQ hourly chart to illustrate standard deviation analysis.
The importance of respecting certain standard deviation levels for continuation trades is emphasized.
Daily charts can also be analyzed using standard deviations for longer-term trading strategies.
The fractal nature of price action allows standard deviation analysis to work across all time frames.
Intraday examples demonstrate how standard deviations can be used for day trading.
The video concludes with an explanation of how to apply standard deviations in various market conditions.
Transcripts
what is good we are back with another
video of the trading Den today's module
we will be going over these standard
deviations now standard deviations are
used for Price targets you can take
partials or your full position off at
these standard deviations and they are
used to frame retracements or reversals
off of them now if we accumulate at one
of these standard deviations we can
expect an accumulation phase to then go
into an
expansions so so this right here is what
these standard deviations look like I
will give you my settings right now
these are the settings doesn't matter
where the numbers are just frame it just
like this you can change it to whatever
color you would like but these checks
and these numbers need to be on there go
ahead and screenshot this whatever you
want here they they are let's get into
what it should look like so here we have
a depiction of what a chart could look
like so right here we can see we have an
accumulation phase right here every move
starts with a turtle soup so right here
we have a low take in now what you want
to be looking for is the manipulation
leg so we have a high here into a new
low so this leg right here would be your
manipulation now we take that uh
standard deviation FIB tool and measure
the manipulation right here is your
manipulation phase you measure from the
high to the low and then the standard
deviations will project out
now let me line this up there so -2 2
and2 the red area we will go into that
in a minute
now5 or sorry 0.5 to -1 is where you can
frame an accumulation phase from so as
you see right here whenever we get there
we have a run on stops and then a
continuation to -2 -2 A2 so this right
here can be used to identify
accumulation phases on intraday charts
so moving on to ne2 -2.5 this is where
you can frame a reversal or retracement
from this is where price likes to
reverse and retrace off of because
usually it aligns with sell side or buy
side liquidity so right here you see
that we run buy stops and then expand
lower now if it is an expansion lower
and it is a rever or a retracement sorry
into a higher time frame PD array if we
respect -2
-2.5 the easiest draw is measure the
entire range from that low that we
measured the standard deviation from to
the high that this low made
and
then we measure out equilibrium of the
range this is your target if you want to
take shorts up here and then you target
this 05 because we do not have to
reverse the entire move this can be a
retracement into a continuation
expansion so you target the 0. five and
this is where you can frame Longs off of
so whenever we get back down
here this can now be a new man ulation
leg if it had a run on stops as you see
here we have a run on stops this can now
be measured as well but 0.5 if we
respect -2.5 and -2 the equilibrium is
your price Target and a place to frame a
long for a continuation off of now
moving up -4 is where
price likes to stop at and either
accumulate or have a full on reversal -4
a turtle soup will usually occur if we
are going to have a reversal so this is
where you do you do not want to be
trying to frame a continu continuation
sorry a continuation trade off of4 this
is where reversals are most likely to
happen so let's hop into the charts and
give some examples right here we are on
the NASDAQ hourly chart and as you see
right here we have an accumulation phase
and right here we have that run on stops
and then we have this expansion higher
now whenever it expands higher we can
now frame this as our manipulation so
what do we do draw out the FIB tool take
it from the low to the high click on
standard deviations now what did I say
here this neg1 to.5 can be an
accumulation phase as you see right here
we have a little accumulation a little
more accumulation and then an expansion
to -2 -2.5 and as you see we continue to
respect it expansion lower so now what
do we measure
out we measure out equilibrium of this
entire range so right here as you see we
continue check out the bodies I didn't
even realize that check out the bodies
all bodies respect that so then we
continue up do not run these highs and
expand lower this is where you could
kind of expect to see this low but as
you see we do not deliver that low like
I said four we do not have to deliver
that low equilibrium is your price
Target and a way to frame Longs off of
so let's hop into another example so
here we are on the NASDAQ daily chart
right price is fractal it works on all
time frames but right here you see we
have a high we have a run on all of
these equal lows throughout here and
then we have an expansion higher measure
from the low to the
high5 to1 we have a little accumulation
here right we have this down candle we
have this small candle expansion up what
can we expect -2 to
-2.5 we come here we accumulate looks
like we're expanding lower could see
equilibrium but we have a new low so
this can be the equilibrium that we
measure out we do not have to come the
entire way to this low to this High just
because we already have a new prominent
low so this would be the equili berum
that we would be looking for expansion
higher what can we see now we could come
the entire way that right this is real
time we could come the entire way up to
-4 now so 18, 385 could be the target
for this daily expansion because we have
now closed Above This range right here
after getting this retracement from -2
to -2.5 and then expansion higher so we
we can expect to see -4 now you were
watching this course before this could
even happen so we are on the daily chart
it's going to take a while to happen
come back see if it actually happens
let's move on to another one so here we
are on the 4our NASDAQ chart what do you
see throughout this price action right
we have manipulation we have a run on
stops expansion higher we have a high we
have a low so we measure from this low
to this High what do you see we
disrespect
-2 to
-2.5 we have an accumulation here we can
expect to see4 now since we disrespected
and closed above these two
areas so here's -4 let me line that up
where do we stop right there and right
now we are accumulating to maybe get
another expansion but you do not want to
be trying to take a swing position right
because this is the 4 Hour you're not
taking intraday trades off the 4 Hour
you don't want to be taking a swing
trade to have continuation yet until we
show that we want to expand so we hit
that -4 now we're starting to accumulate
once again so here we are on the NASDAQ
15minute right here in this piece of
price action you can see we have a run
on buy stops and then an expansion lower
so we have a run on buy stops expansion
lower let's move this over we measure
from the high to the
low
-10.5 accumulation phase or distribution
cuz we are in a market maker sell model
distribution then we go straight to -2
and remember I said this is why it's
easier on the intraday charts to measure
out these standard deviations cuz
intraday when you're framing a trade it
usually will line up with liquidity as
you see respect -2 -2.5 and then we have
a fullon reversal from there
so here we are on the NASDAQ 15 minute
once again I'm going to show you some
more examples on the intraday charts
just because day Traders we like to
catch the daily move so right here you
can see we have a run on these buy stops
right here inside of a higher time frame
PD rray you can tell because this is
just displacement lower so this is
probably an hourly imbalance and right
here we have a high we have a low so we
measure from the high to the low
.55 and 1 distribution phase expansion
down to -2 -2.5 and then a fullon
reversal so let's go into another
example so here we are on the NASDAQ 5
minute chart you can see this piece of
price action sweeps all of these equal
lows so we measure out uh from here to
here where do we go
.5 uh we come into ne1 and .5 accumulate
go up expand to here then we come the
whole way back down run these stops and
now we have a high right this is a swing
high right here you can tell it comes
into this fair value Gap Above This High
lower high lower high swing High measure
from this low to this High
sorry expand as you see we come straight
through Nega
-1.5 expansion to -2 -22 we accumulate
expansion higher and then we hit that -4
the entire way over here we do not quite
get there yet until over there so for
the last example we're on the one minute
chart this is actually at 350 in the
morning but it works any time of the day
because price is fractal time is fractal
we come in we sweep byy stops so now we
have a manipulation leg measure from
high to the recent low coming to -2 -2
and 1/2 notice .51 distribution we have
an accumulation phase here expansion
come down we distribute some more where
do we expand to -4 reversals like to
happen here we come up we reach
equilibrium accumulate above equilibrium
then we expand back lower and we
actually have a run on stops right here
didn't see this example so let's measure
from here to here where do we go -2 -2
and A2 accumulate and then we expand
even lower and you can you can literally
just keep doing this on any manipulation
right distribution here's another entry
for -4 uh right here manipulation here
we don't get we never get our position
stopped out Above This High though then
we get to that -2 area and then this is
intraday price action so that is how
standard deviations work any
manipulation leg you see in the markets
you measure from the high to the low if
it is bearish or from the low to the
high if it is bullish so let's move on
to the next module
Weitere ähnliche Videos ansehen
1722681018149453
MMXM Trader V2 Forex Trading course- ICT Concept: 6.0 The Double Purge An Eye Opener to Liquidity
Boot Camp Day 2: Candlesticks
Catch Explosive Moves On Expiry days | Gamma Blast Strategy Revealed
Aprenda de uma vez por todas a usar os GATILHOS
ICT Daily Profile - London Reversal / New York Continuation
5.0 / 5 (0 votes)