Math 220 Sec 8 5 Part 1
Summary
TLDRThis video explains the normal distribution, focusing on its key properties and how to use the Z-table to calculate probabilities. The normal distribution is a continuous probability curve, symmetric around the mean, with the standard deviation determining its shape. The video covers the 68-95-99.7 rule, which describes how data is distributed within 1, 2, and 3 standard deviations of the mean. It also demonstrates how to use Z-scores and the standard normal distribution table to compute the probability of various outcomes, with practical examples illustrating the application of these concepts in real-world data analysis.
Takeaways
- 😀 The normal distribution is a continuous probability distribution represented by a bell curve.
- 😀 The mean and median of the normal distribution are at the center of the curve.
- 😀 The normal distribution is symmetrical, with equal areas on both sides of the mean.
- 😀 The area under the entire normal distribution curve sums to 1, representing 100% of the probability.
- 😀 The probability of data falling within 1 standard deviation of the mean is 68.27%.
- 😀 The probability of data falling within 2 standard deviations of the mean is 95.45%.
- 😀 The probability of data falling within 3 standard deviations of the mean is 99.73%.
- 😀 Standard deviation determines the spread or flatness of the bell curve, with larger deviations creating flatter curves.
- 😀 The standard normal distribution has a mean of 0 and a standard deviation of 1, making it a baseline for comparison.
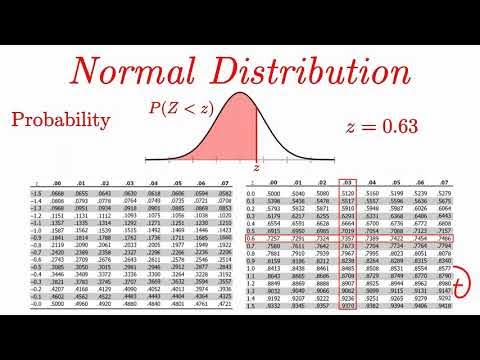
- 😀 To calculate probabilities for a normal distribution, Z-scores are used and can be found in standard normal distribution tables.
- 😀 Z-scores standardize values, allowing us to compare different datasets with different means and standard deviations.
Q & A
What is the main topic discussed in the transcript?
-The main topic discussed is the normal distribution, a type of continuous probability distribution characterized by a bell curve.
How is the normal distribution represented visually?
-The normal distribution is represented as a bell curve, where the peak is at the mean, and the curve is symmetrical around the mean.
What does the area under the normal curve represent?
-The area under the normal curve represents the total probability, and it sums to 1. This means the total probability of all outcomes in the distribution equals 100%.
What does the standard deviation indicate in a normal distribution?
-The standard deviation in a normal distribution determines how spread out the values are from the mean. Larger standard deviations result in a flatter curve, while smaller standard deviations make the curve more peaked.
What percentage of data lies within one standard deviation of the mean?
-68.27% of the data lies within one standard deviation of the mean, with the range extending from one standard deviation below to one standard deviation above the mean.
What is the probability of a data point lying within two standard deviations of the mean?
-The probability of a data point lying within two standard deviations of the mean is 95.45%.
What happens when you increase the number of standard deviations in a normal distribution?
-As the number of standard deviations increases (to three or more), the probability that a data point will fall within this range increases, reaching 99.73% within three standard deviations.
What tool do people use to calculate the areas under the normal curve?
-People use pre-computed tables, like the standard normal cumulative probability table, to find the areas under the normal curve corresponding to different values of the z-score.
How does the z-score relate to the standard normal distribution?
-The z-score standardizes the data, allowing it to be compared to the standard normal distribution with a mean of 0 and a standard deviation of 1.
What is the purpose of using a complement when calculating probabilities from the z-table?
-The complement is used when the probability question asks for values greater than a specific z-score. Since the table gives areas to the left of the z-score, we subtract the table value from 1 to find the area to the right.
Outlines

Dieser Bereich ist nur für Premium-Benutzer verfügbar. Bitte führen Sie ein Upgrade durch, um auf diesen Abschnitt zuzugreifen.
Upgrade durchführenMindmap

Dieser Bereich ist nur für Premium-Benutzer verfügbar. Bitte führen Sie ein Upgrade durch, um auf diesen Abschnitt zuzugreifen.
Upgrade durchführenKeywords

Dieser Bereich ist nur für Premium-Benutzer verfügbar. Bitte führen Sie ein Upgrade durch, um auf diesen Abschnitt zuzugreifen.
Upgrade durchführenHighlights

Dieser Bereich ist nur für Premium-Benutzer verfügbar. Bitte führen Sie ein Upgrade durch, um auf diesen Abschnitt zuzugreifen.
Upgrade durchführenTranscripts

Dieser Bereich ist nur für Premium-Benutzer verfügbar. Bitte führen Sie ein Upgrade durch, um auf diesen Abschnitt zuzugreifen.
Upgrade durchführenWeitere ähnliche Videos ansehen

Finding Areas Using the Standard Normal Table (for tables that give the area between 0 and z)

z score word problems

Peluang Distribusi NORMAL beserta Contoh Soal Pembahasan

Probabilitas dan Statistik: 8.8 Central Limit Theorem Contoh

Distribusi Probabilitas Normal

Normal Distribution EXPLAINED with Examples
5.0 / 5 (0 votes)
