Cara membuat grafik fungsi kuadrat
Summary
TLDRIn this educational video, the presenter teaches viewers how to graph a quadratic function using the equation f(x) = x² - 6x + 5. The tutorial covers key steps including finding the coefficients (a, b, and c), determining the x and y intercepts, calculating the axis of symmetry, and locating the vertex of the parabola. Viewers are guided on how to plot the graph on a Cartesian plane, ensuring they understand the process to visualize quadratic functions easily. The video is clear, concise, and aims to help students grasp the concept with practical examples.
Takeaways
- 😀 The video focuses on explaining how to draw the graph of a quadratic function.
- 😀 The host encourages viewers to like, subscribe, comment, and share to support the channel.
- 😀 Viewers are invited to send in math problems for free assistance, limited to one question per submission.
- 😀 The quadratic function discussed is f(x) = x² - 6x + 5, and the process begins by identifying the coefficients a, b, and c.
- 😀 The coefficient 'a' is 1 (from the x² term), 'b' is -6 (from the x term), and 'c' is 5 (the constant term).
- 😀 The first step in graphing the quadratic is finding the x-intercepts by setting f(x) = 0 and factoring the equation.
- 😀 The equation x² - 6x + 5 = 0 factors into (x - 1)(x - 5) = 0, giving x-intercepts at x = 1 and x = 5.
- 😀 The second step is finding the y-intercept by setting x = 0 in the equation, resulting in y = 5.
- 😀 The third step involves calculating the axis of symmetry using the formula x = -b/2a, which results in x = 3 for this function.
- 😀 The final step is to determine the coordinates of the vertex using the formula for x and y values, leading to the vertex at (3, -4).
- 😀 The graph is drawn with the x- and y-intercepts, the vertex, and the axis of symmetry clearly marked, and the curve is sketched accordingly.
Q & A
What is the main topic of the video?
-The video focuses on how to graph a quadratic function, specifically the function f(x) = x^2 - 6x + 5.
What are the coefficients of the quadratic function f(x) = x^2 - 6x + 5?
-The coefficients are: a = 1 (coefficient of x^2), b = -6 (coefficient of x), and c = 5 (constant).
How do you find the x-intercepts of the quadratic function?
-The x-intercepts are found by setting f(x) equal to 0 and solving the quadratic equation. For f(x) = x^2 - 6x + 5, factoring gives the solutions x = 1 and x = 5.
What is the y-intercept of the function f(x) = x^2 - 6x + 5?
-To find the y-intercept, set x = 0 in the equation. Substituting x = 0 into f(x) = x^2 - 6x + 5 gives y = 5. Therefore, the y-intercept is the point (0, 5).
What is the formula used to find the axis of symmetry?
-The formula for the axis of symmetry is x = -b / (2a). For the function f(x) = x^2 - 6x + 5, with a = 1 and b = -6, the axis of symmetry is x = 3.
How do you calculate the vertex of the parabola?
-The x-coordinate of the vertex is found using the axis of symmetry formula, x = -b / (2a). Once the x-coordinate (3 in this case) is found, substitute it back into the original equation to find the y-coordinate. For this function, the vertex is (3, -4).
What is the significance of the axis of symmetry in graphing a quadratic function?
-The axis of symmetry is a vertical line that divides the parabola into two symmetrical halves. It passes through the vertex and helps in plotting the graph accurately.
How is the graph of the quadratic function shaped?
-The graph of a quadratic function is a U-shaped curve called a parabola. For f(x) = x^2 - 6x + 5, the parabola opens upwards because the coefficient of x^2 (a = 1) is positive.
What does the point (3, -4) represent on the graph?
-The point (3, -4) represents the vertex of the parabola, which is the minimum point on the graph since the parabola opens upwards.
How can you ensure the graph is symmetric?
-To ensure symmetry, plot points on either side of the axis of symmetry (x = 3), as they should be equidistant from the axis. The graph will mirror itself on both sides of this axis.
Outlines

Dieser Bereich ist nur für Premium-Benutzer verfügbar. Bitte führen Sie ein Upgrade durch, um auf diesen Abschnitt zuzugreifen.
Upgrade durchführenMindmap

Dieser Bereich ist nur für Premium-Benutzer verfügbar. Bitte führen Sie ein Upgrade durch, um auf diesen Abschnitt zuzugreifen.
Upgrade durchführenKeywords

Dieser Bereich ist nur für Premium-Benutzer verfügbar. Bitte führen Sie ein Upgrade durch, um auf diesen Abschnitt zuzugreifen.
Upgrade durchführenHighlights

Dieser Bereich ist nur für Premium-Benutzer verfügbar. Bitte führen Sie ein Upgrade durch, um auf diesen Abschnitt zuzugreifen.
Upgrade durchführenTranscripts

Dieser Bereich ist nur für Premium-Benutzer verfügbar. Bitte führen Sie ein Upgrade durch, um auf diesen Abschnitt zuzugreifen.
Upgrade durchführenWeitere ähnliche Videos ansehen
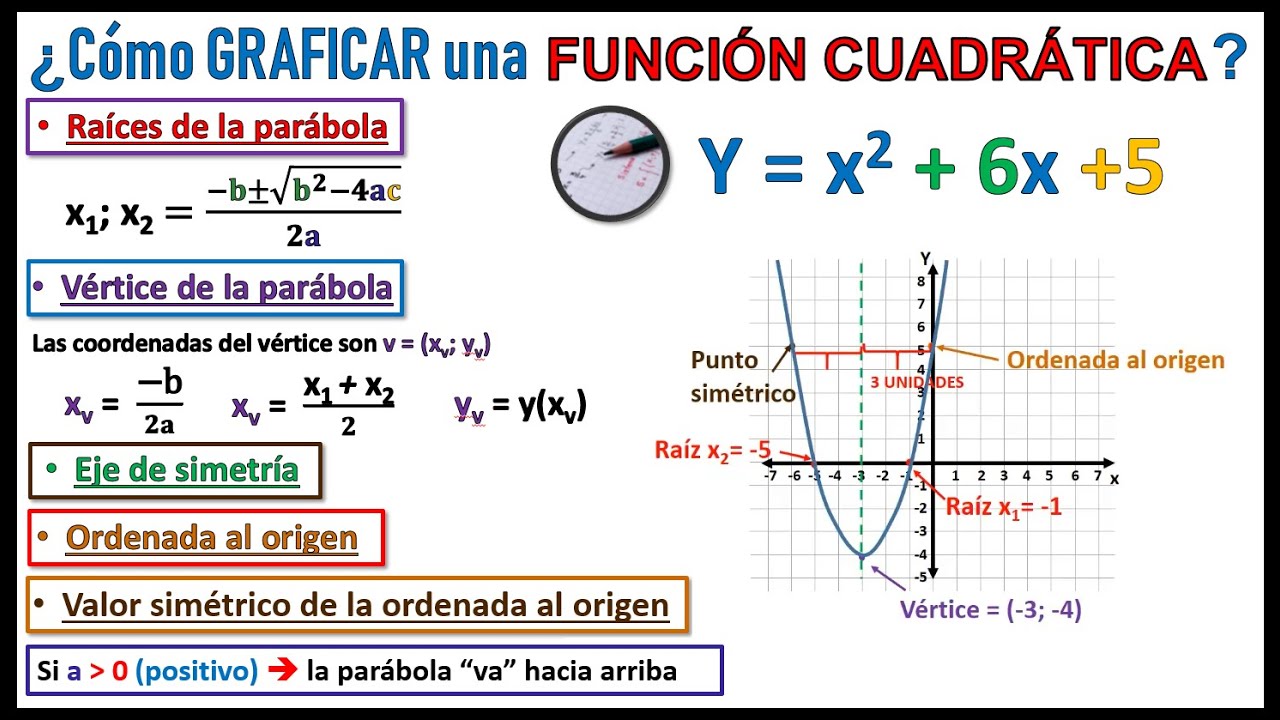
¿Cómo GRAFICAR una función CUADRÁTICA? RAÍCES, VÉRTICE, ORDENADA AL ORIGEN y MÁS
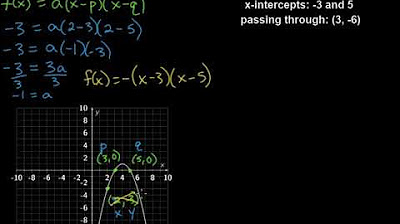
Writing Quadratic Functions in Intercept Form
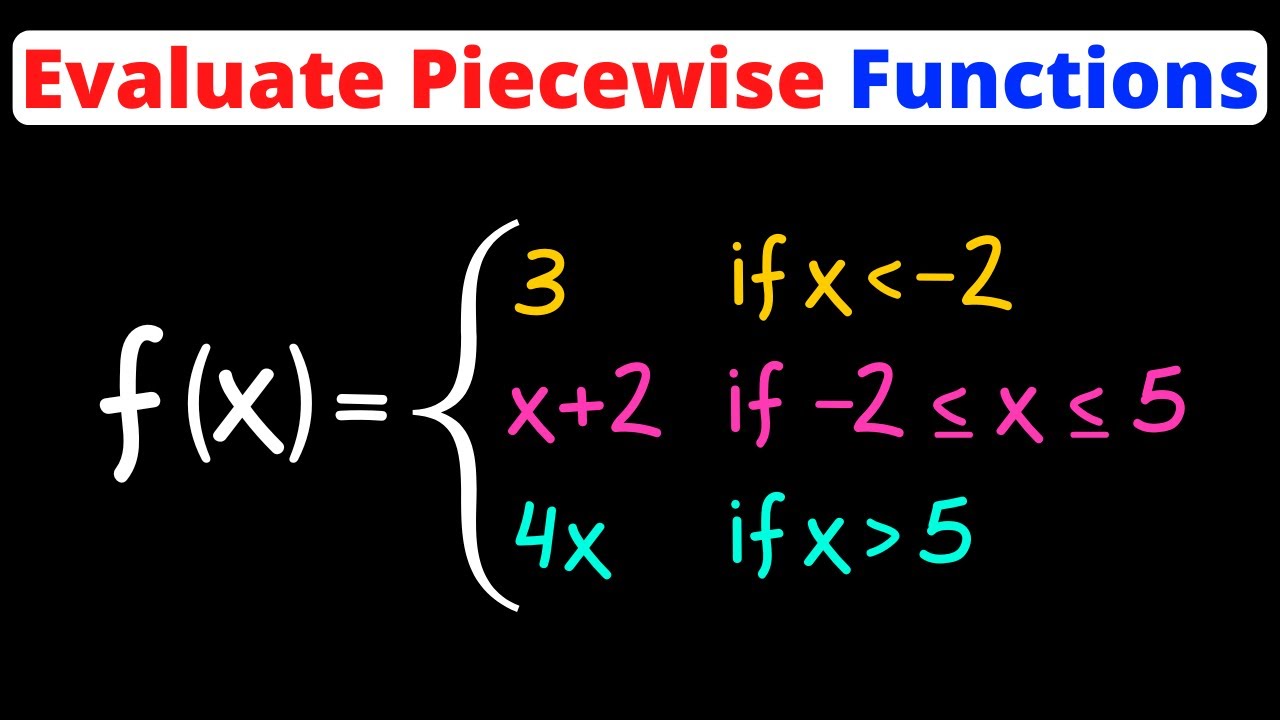
Evaluate a Piecewise Function | Eat Pi
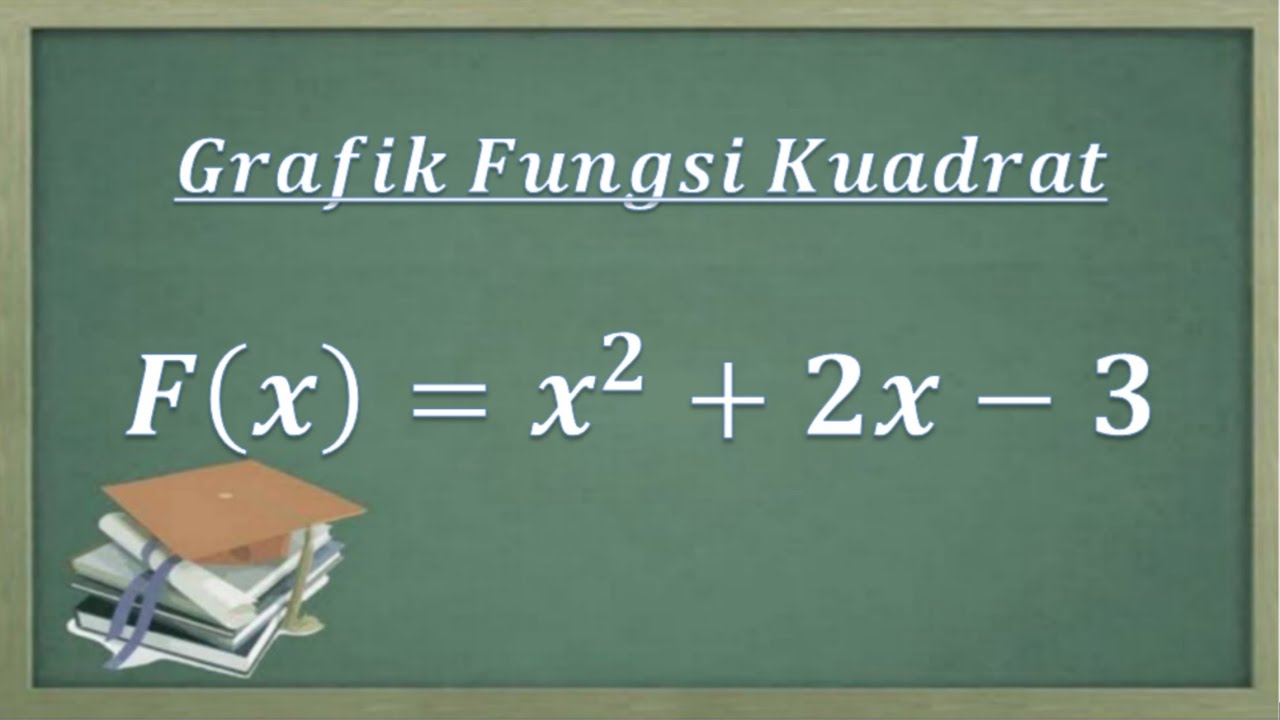
Cara mudah menggambarkan grafik fungsi kuadrat

Inverse of One-to-One Function | Grade 11- General Mathematics
PERSAMAAN KUADRAT part ZERO-ONE
5.0 / 5 (0 votes)
