REGRESI LINEAR I Best Fit
Summary
TLDRThis video explains how to derive the equation of a linear regression line from bivariate data, specifically predicting the profit based on the number of store branches. Using a dataset with store branch counts and corresponding profits, the video walks through the calculation of the regression equation (y = 14x + 5), where x represents the number of branches and y represents the profit in millions. The process includes calculating averages, covariance, and variance before determining the best-fit line. The video highlights how this model can predict profits, like the 103 million rupiah forecast for seven branches.
Takeaways
- 😀 Linear regression is used to predict the relationship between two variables, in this case, store branches and profit.
- 😀 The regression line equation derived from the data is y = 14x + 5.
- 😀 The x variable represents the number of store branches, while the y variable represents the profit in millions of rupiah.
- 😀 By substituting values into the regression equation, you can predict the profit for any given number of store branches.
- 😀 For 7 store branches, the predicted profit using the equation y = 14x + 5 is 103 million rupiah.
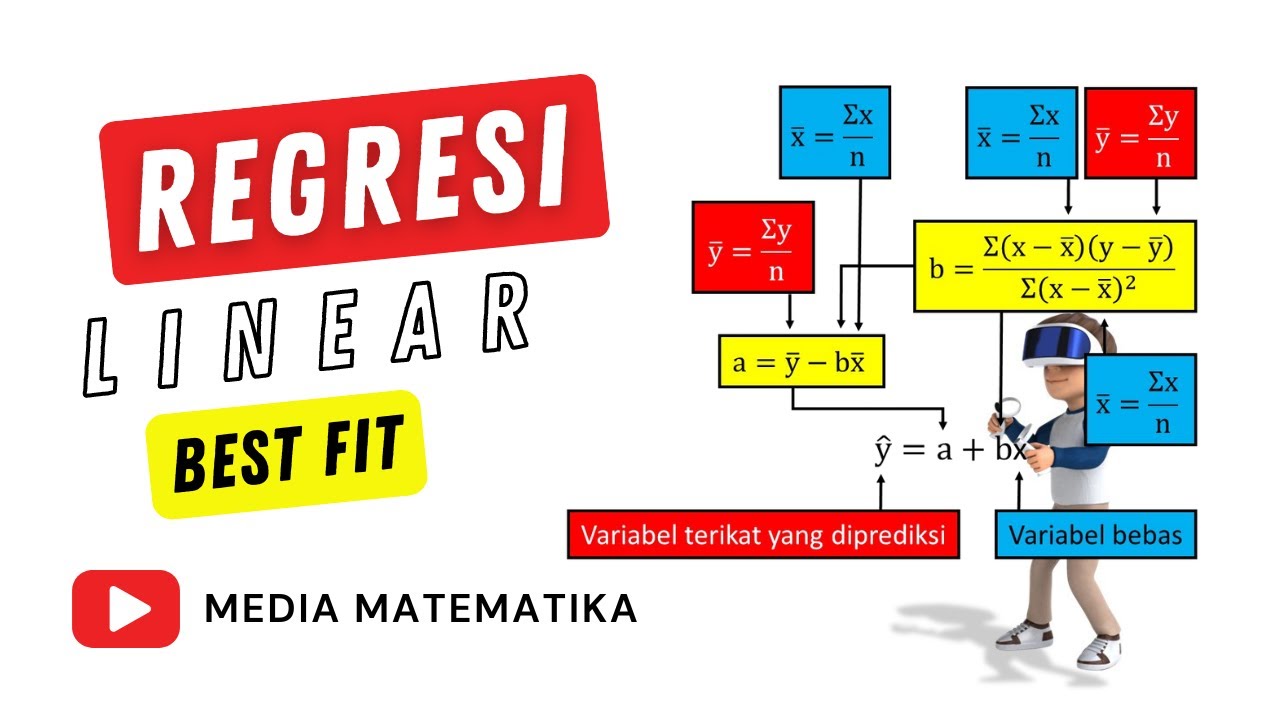
- 😀 The process of calculating the regression equation involves finding the mean of both x and y values (X̄ and Ȳ).
- 😀 Covariance (Sxy) helps in determining the relationship between x and y values, calculated as 17.5 in this example.
- 😀 The variance (Sx²) of x values is used to calculate the slope of the regression line, which in this case is 14.
- 😀 The slope (14) shows that for every additional store branch, the profit increases by 14 million rupiah.
- 😀 The y-intercept (5) is the predicted profit when there are zero store branches.
- 😀 This linear regression model provides a useful tool for forecasting future profits based on the number of store branches.
Q & A
What is the purpose of the video?
-The video explains how to calculate the linear regression equation (best-fit line) for bivariate data and demonstrates how to use this equation for predictions.
What are the variables used in the analysis?
-In the analysis, 'x' represents the number of store branches, and 'y' represents the profit in millions of Indonesian Rupiah.
How is the best-fit line for the data determined?
-The best-fit line is determined using the linear regression equation, which is derived from the data. In the example, the equation is y = 14x + 5.
What does the equation y = 14x + 5 represent?
-The equation y = 14x + 5 represents the linear regression line that predicts the profit ('y') based on the number of store branches ('x').
How is the predicted profit calculated for 7 store branches?
-For 7 store branches, the value of x is substituted into the equation y = 14x + 5. Substituting x = 7 gives y = 14 * 7 + 5, resulting in a predicted profit of 103 million Rupiah.
What is the significance of the equation y = 14x + 5?
-This equation is important because it provides a model to predict profits based on the number of store branches. It represents the relationship between the two variables in the dataset.
How are the means of x and y calculated?
-The means are calculated by summing all the values of each variable and then dividing by the number of data points. For x, the mean is 2.5, and for y, the mean is 40.
What is the formula for calculating the covariance (sxy)?
-The covariance (sxy) is calculated using the formula sxy = ΣXY / n - (X̄ * Ȳ), where ΣXY is the sum of the products of corresponding x and y values, and X̄ and Ȳ are the means of x and y, respectively.
How is the variance of x (sx²) calculated?
-The variance of x (sx²) is calculated using the formula sx² = Σx² / n - X̄², where Σx² is the sum of the squared values of x, and X̄ is the mean of x.
What role do the covariance and variance calculations play in determining the regression equation?
-The covariance (sxy) and variance (sx²) calculations are used to derive the slope (14) and intercept (5) of the regression equation. The slope represents the change in profit for each additional store branch, and the intercept is the predicted profit when there are zero store branches.
Outlines

Dieser Bereich ist nur für Premium-Benutzer verfügbar. Bitte führen Sie ein Upgrade durch, um auf diesen Abschnitt zuzugreifen.
Upgrade durchführenMindmap

Dieser Bereich ist nur für Premium-Benutzer verfügbar. Bitte führen Sie ein Upgrade durch, um auf diesen Abschnitt zuzugreifen.
Upgrade durchführenKeywords

Dieser Bereich ist nur für Premium-Benutzer verfügbar. Bitte führen Sie ein Upgrade durch, um auf diesen Abschnitt zuzugreifen.
Upgrade durchführenHighlights

Dieser Bereich ist nur für Premium-Benutzer verfügbar. Bitte führen Sie ein Upgrade durch, um auf diesen Abschnitt zuzugreifen.
Upgrade durchführenTranscripts

Dieser Bereich ist nur für Premium-Benutzer verfügbar. Bitte führen Sie ein Upgrade durch, um auf diesen Abschnitt zuzugreifen.
Upgrade durchführenWeitere ähnliche Videos ansehen
REGRESI LINEAR l Metode Kuadrat Terkecil

Metode Numerik Pertemuan Regresi Linier
Simple Linear Regression Simplified | Orange Data Mining Tutorial
Cara Menghitung Analisis Regresi Sederhana secara Manual

Regression and R-Squared (2.2)
Lec-4: Linear Regression📈 with Real life examples & Calculations | Easiest Explanation
5.0 / 5 (0 votes)
