Introduction to Univariate Analysis
Summary
TLDRThis video tutorial provides an introduction to basic univariate analysis using SPSS, covering essential steps such as navigating the software, loading datasets, and understanding levels of measurement (nominal, ordinal, and interval/ratio). The video demonstrates how to calculate appropriate statistics for each level, including mode for nominal variables, median and range for ordinal variables, and mean and standard deviation for interval/ratio variables. By using the NES 2008 dataset, it illustrates how to generate frequency tables and interpret data, with practical tips on ensuring correct reporting of category labels and statistics. The session sets the foundation for further data analysis in SPSS.
Takeaways
- 😀 SPSS is being introduced as a tool for conducting basic univariate analysis, such as creating frequency distributions, graphs, and performing hypothesis tests.
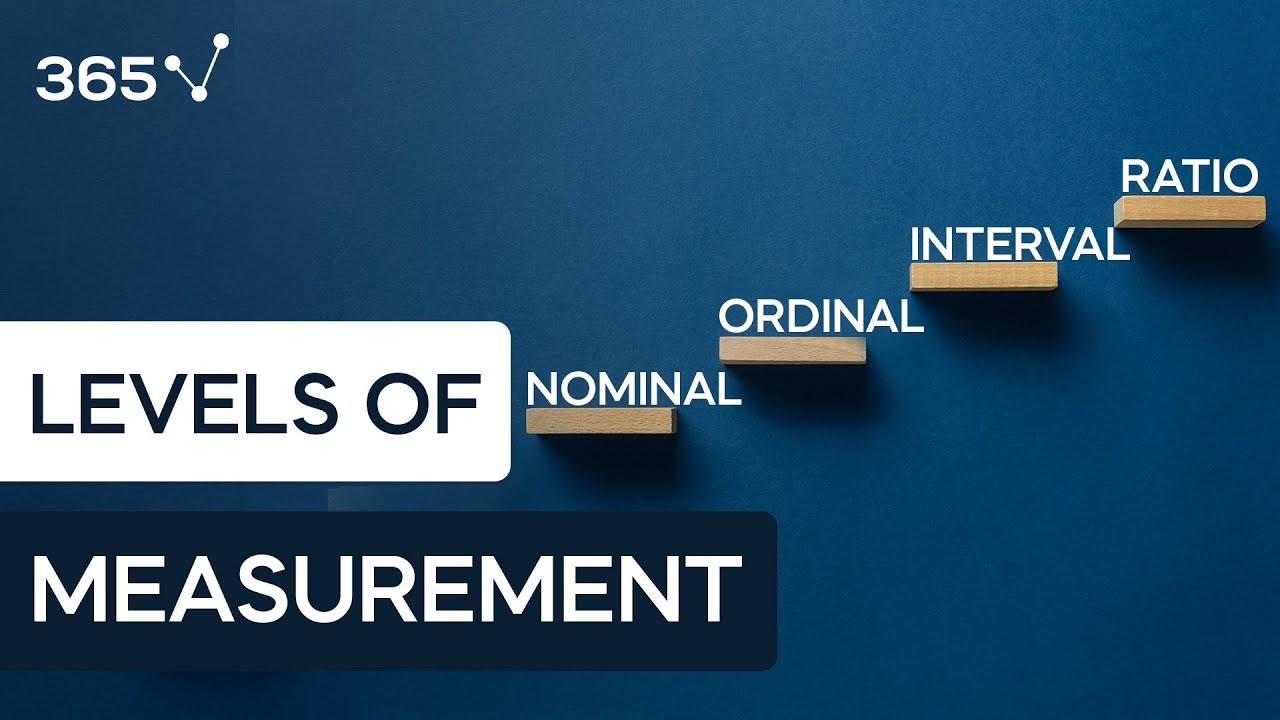
- 😀 The relationship between concepts and variables is emphasized: concepts are measured through variables, which can be classified into nominal, ordinal, and interval/ratio levels of measurement.
- 😀 Understanding the level of measurement for a variable is crucial for determining the appropriate statistical analysis. Nominal, ordinal, and interval/ratio levels offer different insights into the data.
- 😀 Nominal variables can only use the mode as a measurement of central tendency. For example, the employee status variable is nominal, and its mode is the most frequent category, such as 'working now'.
- 😀 For nominal variables, a V ratio can also be calculated, though this requires manual calculation outside of SPSS, as SPSS does not provide it for nominal data.
- 😀 Ordinal variables allow for ranking and ordering, and both the mode and median can be calculated. An example from the transcript is the 'education level' variable with categories of different years of education.
- 😀 In SPSS, ordinal variables are represented by numeric codes, but it's important to report the actual category labels rather than the numeric codes when interpreting results.
- 😀 Interval/ratio variables offer precise differences between units of analysis, and in SPSS, they allow for the calculation of mean, variance, and standard deviation. An example given is the 'education' variable, where zero has real meaning.
- 😀 The key distinction between interval and ratio variables is that ratio variables have a meaningful zero, representing the absence of the measured characteristic.
- 😀 SPSS generates tables that provide frequency distribution and basic statistics based on the level of measurement of the variable, which helps in interpreting the data accurately.
Q & A
What is the primary focus of this SPSS tutorial?
-The primary focus of this tutorial is to introduce users to basic univariate analysis in SPSS, covering the calculation of various statistics for nominal, ordinal, and interval/ratio variables.
What are the three levels of measurement explained in the video?
-The three levels of measurement explained in the video are nominal, ordinal, and interval/ratio. Each level determines the type of statistical analysis that can be performed.
What is the appropriate measure of central tendency for nominal variables?
-For nominal variables, the appropriate measure of central tendency is the mode, which indicates the most frequent category.
How is SPSS used to calculate the mode for a nominal variable?
-In SPSS, the mode for a nominal variable is calculated by selecting the variable (e.g., employee status) and using the 'Frequencies' function under 'Analyze' and 'Descriptive Statistics,' where the mode is the only available measure.
Why is the V-ratio important for nominal variables, and how is it calculated?
-The V-ratio is a measure of dispersion for nominal variables, representing the proportion of cases outside the modal category. It must be calculated manually as SPSS does not provide it for nominal variables.
What additional measures are used for ordinal variables besides mode?
-For ordinal variables, besides mode, SPSS can calculate the median, quartiles, range, and minimum/maximum values, providing more insights into the distribution of the data.
What is the key difference between ordinal and nominal variables in SPSS?
-The key difference is that ordinal variables have a defined order or ranking, whereas nominal variables only categorize data without any inherent order. SPSS reflects this by assigning numeric codes to ordinal variables for ranking.
How should ordinal variable categories be reported in research, according to the tutorial?
-When reporting ordinal variables, researchers should use the category labels (e.g., '13 or more years of education') instead of the numeric codes (e.g., '3') assigned to each category by SPSS.
What is the distinction between interval and ratio variables, and how does it affect their analysis?
-Interval and ratio variables both measure exact differences between units of analysis, but ratio variables have a true zero value, indicating the absence of the measured attribute. This distinction allows for more meaningful calculations, such as the mean and standard deviation.
How does SPSS handle the calculation of statistics for interval/ratio variables?
-For interval/ratio variables, SPSS calculates all central tendency and dispersion measures, including the mean, standard deviation, and variance, allowing for detailed analysis of the data.
Outlines

Dieser Bereich ist nur für Premium-Benutzer verfügbar. Bitte führen Sie ein Upgrade durch, um auf diesen Abschnitt zuzugreifen.
Upgrade durchführenMindmap

Dieser Bereich ist nur für Premium-Benutzer verfügbar. Bitte führen Sie ein Upgrade durch, um auf diesen Abschnitt zuzugreifen.
Upgrade durchführenKeywords

Dieser Bereich ist nur für Premium-Benutzer verfügbar. Bitte führen Sie ein Upgrade durch, um auf diesen Abschnitt zuzugreifen.
Upgrade durchführenHighlights

Dieser Bereich ist nur für Premium-Benutzer verfügbar. Bitte führen Sie ein Upgrade durch, um auf diesen Abschnitt zuzugreifen.
Upgrade durchführenTranscripts

Dieser Bereich ist nur für Premium-Benutzer verfügbar. Bitte führen Sie ein Upgrade durch, um auf diesen Abschnitt zuzugreifen.
Upgrade durchführenWeitere ähnliche Videos ansehen

Pendahuluan Statistika - Pertemuan 1

Statistics in singular and in plural sense
Scales of Measurement: Nominal, Ordinal, Interval and Ratio Scale

‼️PENGENALAN SPSS | JENIS DATA & CONTOH KASUS DASAR - Part2
Levels of measurement - Research Methods [A-Level Psychology]
Data Science & Statistics: Levels of measurement
5.0 / 5 (0 votes)
