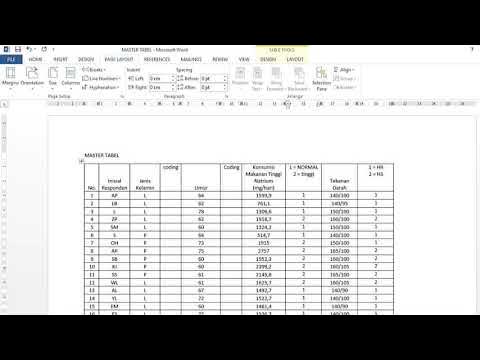
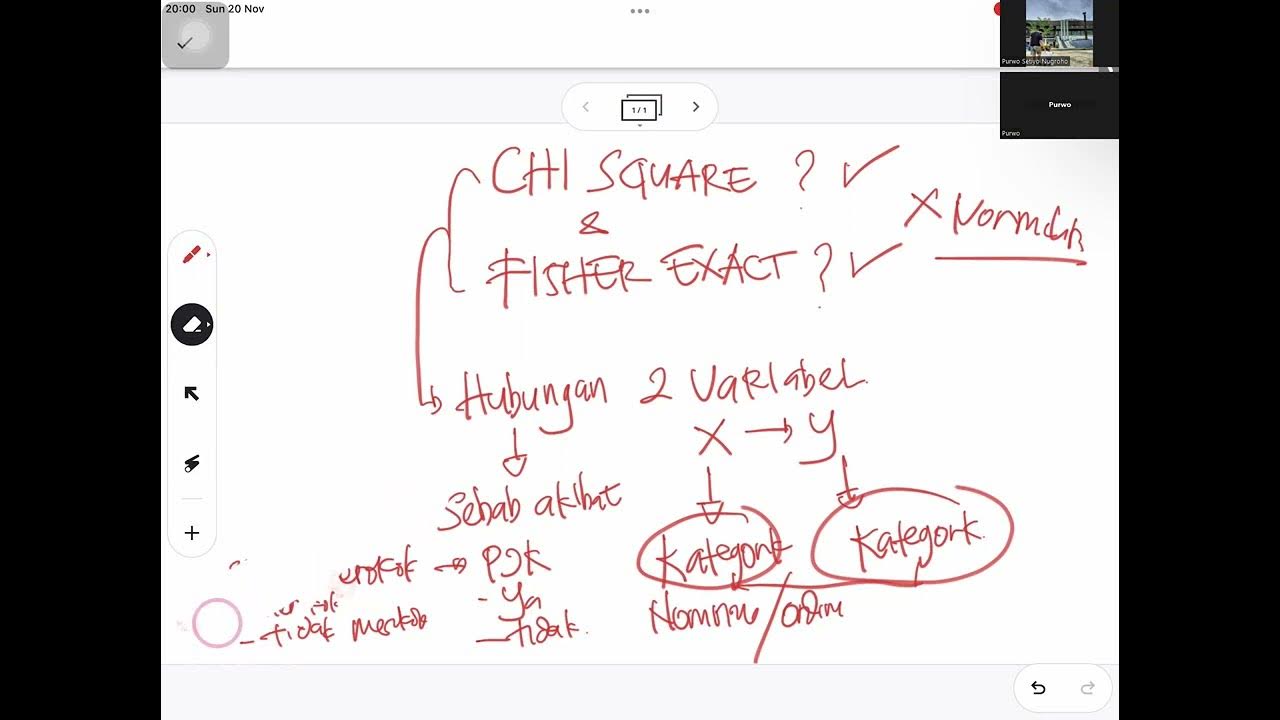
mencari uji alternatif setelah uji chi square dengan tabel lebih dari 2x2 tidak memenuhi syarat
Summary
TLDRThis video explains how to handle issues when performing a chi-square test with a table larger than 2x2, focusing on the challenges faced when the test doesn't meet assumptions, such as expected counts below 5 or cells with zero values. It demonstrates the use of SPSS for data coding and the analysis of nutrition status and dimensions, and addresses how Fisher's Exact Test appears only for 2x2 tables. The presenter also provides a solution by merging categories to create a valid 2x2 table, ensuring accurate results despite the statistical challenges, with a final interpretation that confirms no significant relationship between nutrition status and the dimensions of elderly individuals.
Takeaways
- 😀 Proper data coding is crucial when performing a chi-square test in SPSS, ensuring that all categories are accurately represented.
- 😀 A chi-square test's assumptions must be met, including having no expected counts below 5 in more than 25% of cells for a valid result.
- 😀 When working with tables larger than 2x2, Fisher’s Exact Test can be used as an alternative to chi-square if assumptions are violated.
- 😀 If there are cells with expected counts below 5, it's necessary to combine categories in the contingency table to meet the chi-square test's assumptions.
- 😀 In SPSS, the *Descriptive Statistics* and *Crosstabs* options allow you to check the expected count for each cell before proceeding with the chi-square test.
- 😀 Combining categories in a contingency table is an effective method to create a 2x2 table that can meet the chi-square assumptions.
- 😀 It’s essential to use thoughtful reasoning when combining categories, considering both statistical and practical significance in the data.
- 😀 Fisher's Exact Test is only available for tables that can be reduced to 2x2 format, and its result provides the p-value for interpreting the test.
- 😀 A p-value greater than 0.05 in Fisher’s Exact Test indicates no significant relationship between the variables being tested, which supports the null hypothesis.
- 😀 Small sample sizes and complex contingency tables often violate the assumptions of the chi-square test, making Fisher's Exact Test a reliable alternative.
- 😀 This approach helps address issues with statistical tests when dealing with sparse data, ensuring that valid conclusions can still be drawn.
Q & A
What is the main issue discussed in the video regarding the Chi-Square test?
-The main issue is that the Chi-Square test fails when the data has cells with expected counts below 5 or contains empty cells, particularly when working with a table larger than 2x2.
What is the alternative test mentioned when the Chi-Square test fails?
-The alternative test mentioned is Fisher’s Exact Test, which is used when the Chi-Square test assumptions are not met. However, Fisher’s Exact Test does not appear for tables larger than 2x2.
How does the speaker resolve the issue when the Chi-Square test doesn't meet the assumptions?
-The speaker resolves the issue by merging categories in the data, reducing the table to a 2x2 format, which allows the Chi-Square test to be valid and Fisher’s Exact Test to appear.
What does the speaker demonstrate with the SPSS software in the video?
-The speaker demonstrates how to set up variables, code data, perform the Chi-Square test, and interpret the results in SPSS, addressing common problems such as empty cells and low expected counts.
What happens when a table has one or more cells with an expected count of zero?
-When there is a cell with an expected count of zero, the Chi-Square test cannot be performed correctly, and Fisher’s Exact Test will not appear unless the table is 2x2.
What is the significance of merging categories in the data?
-Merging categories helps reduce the table size to 2x2, which satisfies the assumptions for the Chi-Square test and enables the use of Fisher’s Exact Test when needed.
Why does the Fisher’s Exact Test not appear in larger tables?
-Fisher’s Exact Test does not appear for tables larger than 2x2 due to the way the test is designed to work with smaller contingency tables where expected counts can be calculated accurately.
What is the threshold for the expected count in a Chi-Square test?
-In a Chi-Square test, the expected count should be at least 5 for 80% of the cells, and no cell should have an expected count of zero to ensure the validity of the test.
What does a p-value greater than 0.05 indicate in the Chi-Square or Fisher’s Exact test?
-A p-value greater than 0.05 indicates that there is no significant association between the variables, meaning the null hypothesis cannot be rejected.
What was the final result in the video after adjusting the categories and running the Fisher’s Exact Test?
-The final result showed a p-value of 0.503, which was greater than 0.05, indicating that there was no significant relationship between nutritional status and dimensions, and the null hypothesis was accepted.
Outlines

Dieser Bereich ist nur für Premium-Benutzer verfügbar. Bitte führen Sie ein Upgrade durch, um auf diesen Abschnitt zuzugreifen.
Upgrade durchführenMindmap

Dieser Bereich ist nur für Premium-Benutzer verfügbar. Bitte führen Sie ein Upgrade durch, um auf diesen Abschnitt zuzugreifen.
Upgrade durchführenKeywords

Dieser Bereich ist nur für Premium-Benutzer verfügbar. Bitte führen Sie ein Upgrade durch, um auf diesen Abschnitt zuzugreifen.
Upgrade durchführenHighlights

Dieser Bereich ist nur für Premium-Benutzer verfügbar. Bitte führen Sie ein Upgrade durch, um auf diesen Abschnitt zuzugreifen.
Upgrade durchführenTranscripts

Dieser Bereich ist nur für Premium-Benutzer verfügbar. Bitte führen Sie ein Upgrade durch, um auf diesen Abschnitt zuzugreifen.
Upgrade durchführenWeitere ähnliche Videos ansehen

Uji Statistik Chi Square dengan tabel 2X2. cara membaca hasil uji chi square.

Analisis Chi Square dengan aplikasi SPSS

SYARAT MENGGUNAKAN UJI CHI SQUARE DAN FISHER EXACT

Unit-5 | Maths-4 Most Important Questions with Explanation | Specially for Back Students | Aktu Exam

Understanding Chi-Square and Fisher's Exact Tests

How to calculate a Chi-Square Test?
5.0 / 5 (0 votes)
