Chi Square in Genetics & Examples (AP Biology)
Summary
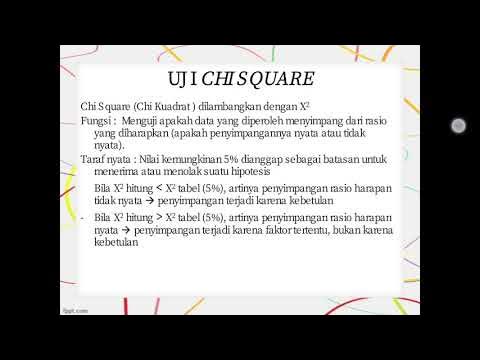
TLDRThis video explains how to use the chi-square goodness-of-fit test to analyze genetic inheritance patterns. It walks viewers through the steps of calculating observed and expected values, using a simple example with giraffes, and demonstrates how to apply the chi-square formula to assess whether observed data fits expected genetic ratios. The video also introduces the concept of the null hypothesis, explaining how to interpret chi-square values and p-values in order to accept or reject hypotheses. Several examples, including inheritance in chickens and dogs, illustrate the application of these statistical methods to real-life genetic problems.
Takeaways
- 😀 Chi-square test is used to analyze whether observed genetic data matches the expected ratios based on inheritance patterns.
- 😀 The null hypothesis (H₀) assumes no significant difference between observed and expected values, meaning any variation is due to chance.
- 😀 The chi-square formula is: χ² = Σ((O - E)² / E), where O is observed and E is expected value.
- 😀 To calculate expected values, you need to know the predicted inheritance ratio based on Mendelian genetics (e.g., 1:1, 1:2:1).
- 😀 Degrees of freedom (df) are calculated by subtracting 1 from the number of categories (e.g., two phenotypes = df = 1).
- 😀 The p-value represents the confidence level; a p-value of 0.05 indicates 95% confidence in the results.
- 😀 Critical values from the chi-square table are used to compare with the calculated chi-square value to decide whether to accept or reject the null hypothesis.
- 😀 If the chi-square value is greater than the critical value, the null hypothesis is rejected, suggesting a significant difference.
- 😀 If the chi-square value is less than the critical value, the null hypothesis is not rejected, meaning the data fits the expected pattern.
- 😀 Real-life examples (like giraffes, chickens, and dogs) are used to illustrate the application of the chi-square test in genetics.
- 😀 The chi-square test helps remove subjective bias and ensures that scientific conclusions are based on statistical evidence, not opinion.
Q & A
What is the chi-square test used for in genetics?
-The chi-square test, or goodness-of-fit test, is used to compare observed data with expected data to determine if there is a significant difference between them. In genetics, it helps analyze inheritance patterns and genetic ratios in offspring.
What are the steps involved in calculating a chi-square value?
-To calculate a chi-square value, you first find the difference between the observed and expected values, square that difference, and then divide by the expected value. This is done for each category (phenotype) and then summed to get the chi-square value.
In the giraffe example, what were the observed values for the tall and short giraffes?
-In the giraffe example, the observed values were 37 tall giraffes and 43 short giraffes.
How do you calculate expected values in the giraffe example?
-The expected values in the giraffe example were calculated based on the assumption of a 1:1 ratio of tall to short giraffes, which is expected from a cross between a heterozygous giraffe and a homozygous recessive giraffe. With 80 total giraffes, the expected values were 40 tall and 40 short giraffes.
What is the null hypothesis in a chi-square test?
-The null hypothesis in a chi-square test suggests that there is no significant difference between the observed and expected values. In the context of genetics, it assumes that any variation is due to random chance, and the observed data aligns with the expected genetic ratio.
What does it mean to 'reject the null hypothesis' in a chi-square test?
-To reject the null hypothesis means that the observed data significantly differs from the expected data, indicating that the genetic pattern may not follow the assumed inheritance model. In this case, the variation is too large to be explained by chance.
How is the critical value determined in a chi-square test?
-The critical value is determined by the degrees of freedom (the number of categories minus one) and the desired p-value (usually 0.05). It is found using a chi-square distribution table, and it helps to decide whether to accept or reject the null hypothesis.
What does a p-value of 0.05 represent in the context of a chi-square test?
-A p-value of 0.05 indicates that there is a 95% probability that the observed data is consistent with the expected data. If the chi-square value is below the critical value associated with a p-value of 0.05, the null hypothesis is not rejected.
Why is the chi-square test important for scientists in genetic research?
-The chi-square test removes subjective bias and personal opinion from data analysis, providing objective, statistical evidence to support or reject a hypothesis. It allows scientists to confirm or refute genetic inheritance patterns based on mathematical and empirical evidence.
In the chicken feather color example, what were the expected and observed values for the phenotypes?
-In the chicken example, the expected values for the phenotypes were 20 black, 40 gray, and 20 white chickens, based on a 1:2:1 ratio from incomplete dominance. The observed values were 16 black, 43 gray, and 21 white chickens.
Outlines

Dieser Bereich ist nur für Premium-Benutzer verfügbar. Bitte führen Sie ein Upgrade durch, um auf diesen Abschnitt zuzugreifen.
Upgrade durchführenMindmap

Dieser Bereich ist nur für Premium-Benutzer verfügbar. Bitte führen Sie ein Upgrade durch, um auf diesen Abschnitt zuzugreifen.
Upgrade durchführenKeywords

Dieser Bereich ist nur für Premium-Benutzer verfügbar. Bitte führen Sie ein Upgrade durch, um auf diesen Abschnitt zuzugreifen.
Upgrade durchführenHighlights

Dieser Bereich ist nur für Premium-Benutzer verfügbar. Bitte führen Sie ein Upgrade durch, um auf diesen Abschnitt zuzugreifen.
Upgrade durchführenTranscripts

Dieser Bereich ist nur für Premium-Benutzer verfügbar. Bitte führen Sie ein Upgrade durch, um auf diesen Abschnitt zuzugreifen.
Upgrade durchführenWeitere ähnliche Videos ansehen

*M* Uji Kecocokan: Frekuensi yang Diduga Sama dan yang Tidak Sama dengan Microsoft Excel dan SPSS

Test for Goodness of Fit - Problem 1 - Chi Square Test - Engineering Mathematics 4

Uji Chi Square (Part 1) | Genetika Tanaman

Distribusi Chi-square, Weibull, t dan F

Chi-Square Tests: Crash Course Statistics #29

Uji Statistik Chi Square dengan tabel 2X2. cara membaca hasil uji chi square.
5.0 / 5 (0 votes)
