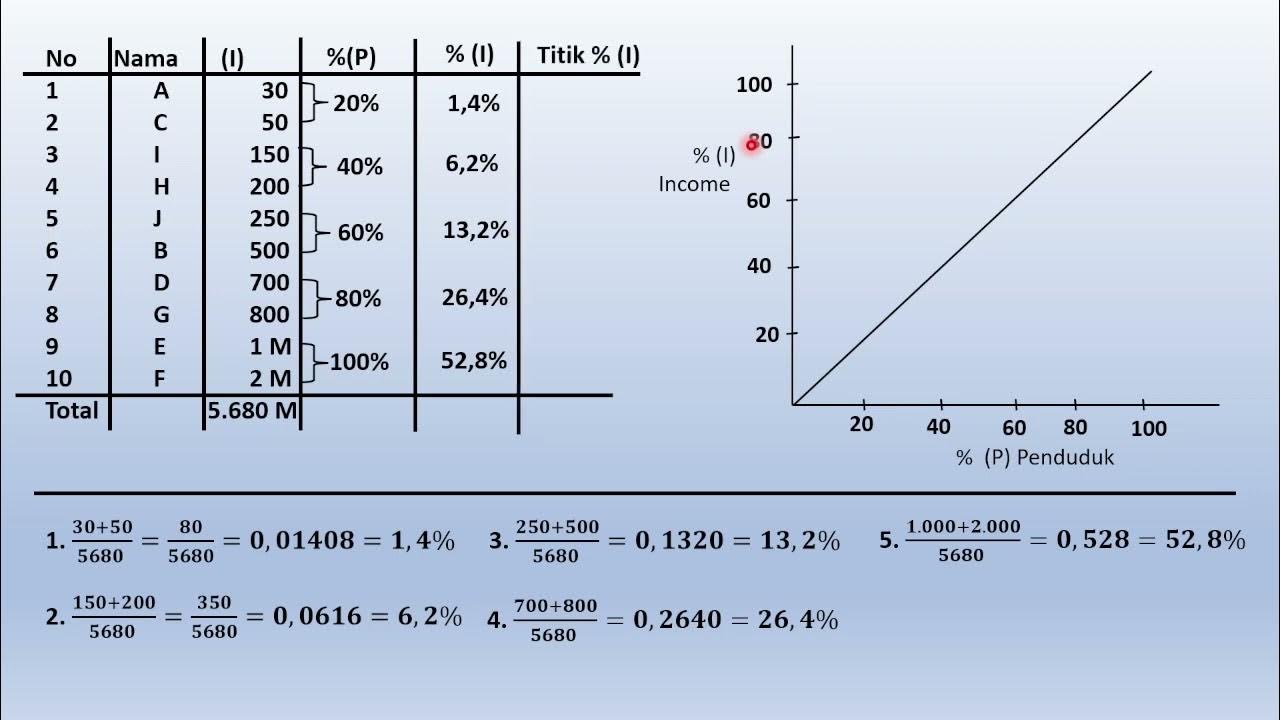
Indikator Ketimpangan Distribusi Pendapatan
Summary
TLDRIn this informative video, the presenter discusses economic inequality, focusing on three key indicators: the Lorenz Curve, Gini Coefficient, and World Bank criteria. The Lorenz Curve illustrates the relationship between income distribution and population percentage, revealing levels of inequality based on its shape. The Gini Coefficient quantifies this inequality, with values ranging from 0 (perfect equality) to 1 (maximum inequality). Lastly, the World Bank criteria assess income distribution among the poorest 40% of the population to determine whether inequality is low, moderate, or high. This comprehensive overview highlights essential tools for understanding economic disparities.
Takeaways
- 📈 The video discusses economic inequality, focusing on income distribution disparity.
- 📊 The Lorenz Curve is a key tool used to visualize income inequality, showing the relationship between the percentage of total income and the percentage of the population.
- 🔄 The diagonal line in the Lorenz Curve represents perfect income equality, while the curve itself indicates the level of inequality.
- 📉 The further the Lorenz Curve is from the diagonal line, the higher the income inequality in a given population.
- ⚖️ The Gini Coefficient quantifies income inequality, with values ranging from 0 (perfect equality) to 1 (maximum inequality).
- 🔍 A Gini Coefficient below 0.3 indicates low inequality, between 0.3 and 0.5 signifies moderate inequality, and above 0.5 indicates high inequality.
- 🌍 The World Bank categorizes income inequality based on the earnings of the poorest 40% of the population.
- 💰 If the poorest 40% earn less than 12% of national income, inequality is considered high; between 12% and 17% is moderate, and above 17% is low inequality.
- 📚 The speaker emphasizes the importance of these indicators for understanding economic disparities in different countries.
- 🙏 The video concludes by thanking the audience and inviting them to future educational content.
Q & A
What is the main topic discussed in the video?
-The main topic is economic inequality, specifically focusing on income distribution and how to measure it.
What are the three indicators used to measure income inequality mentioned in the video?
-The three indicators are the Lorenz Curve, the Gini Coefficient, and the World Bank criteria.
How does the Lorenz Curve represent income distribution?
-The Lorenz Curve shows the relationship between the percentage of total income and the percentage of income recipients in a population over a specific time period.
What does the diagonal line on the Lorenz Curve represent?
-The diagonal line represents perfect income equality, where every percentage of the population receives an equal percentage of total income.
How can we interpret the distance of the Lorenz Curve from the diagonal line?
-The farther the Lorenz Curve is from the diagonal line, the higher the level of income inequality. If it is close to the diagonal, income distribution is more equal.
What is the Gini Coefficient and how is it calculated?
-The Gini Coefficient measures income inequality by calculating the ratio of the area between the Lorenz Curve and the line of equality to the total area under the line of equality.
What does a Gini Coefficient of 0 indicate?
-A Gini Coefficient of 0 indicates perfect income equality, while a coefficient of 1 indicates maximum inequality.
What are the criteria set by the World Bank to classify income inequality?
-The World Bank criteria classify inequality based on the income share of the poorest 40% of the population, with thresholds for high, moderate, and low inequality.
What income share indicates high inequality according to the World Bank?
-If the poorest 40% of the population earns less than 12% of total national income, it indicates high inequality.
Why is understanding these indicators important?
-Understanding these indicators is crucial for assessing the level of economic inequality in a society, which can inform policies and interventions to promote equity.
Outlines

Dieser Bereich ist nur für Premium-Benutzer verfügbar. Bitte führen Sie ein Upgrade durch, um auf diesen Abschnitt zuzugreifen.
Upgrade durchführenMindmap

Dieser Bereich ist nur für Premium-Benutzer verfügbar. Bitte führen Sie ein Upgrade durch, um auf diesen Abschnitt zuzugreifen.
Upgrade durchführenKeywords

Dieser Bereich ist nur für Premium-Benutzer verfügbar. Bitte führen Sie ein Upgrade durch, um auf diesen Abschnitt zuzugreifen.
Upgrade durchführenHighlights

Dieser Bereich ist nur für Premium-Benutzer verfügbar. Bitte führen Sie ein Upgrade durch, um auf diesen Abschnitt zuzugreifen.
Upgrade durchführenTranscripts

Dieser Bereich ist nur für Premium-Benutzer verfügbar. Bitte führen Sie ein Upgrade durch, um auf diesen Abschnitt zuzugreifen.
Upgrade durchführen5.0 / 5 (0 votes)


