Pertemuan 7 Paired sample T Test
Summary
TLDRIn this instructional video for fourth-semester students, the instructor discusses the paired sample t-test, a statistical method used to compare the means of two related groups. The session includes a practical case study on the frequency of clothing purchases before and after classes, illustrating how to interpret statistical results. Key concepts such as significance levels and correlation are highlighted, guiding students on how to analyze their findings effectively. The video concludes with an invitation for students to apply their learning to exercises provided in the course module, ensuring a thorough understanding of the topic.
Takeaways
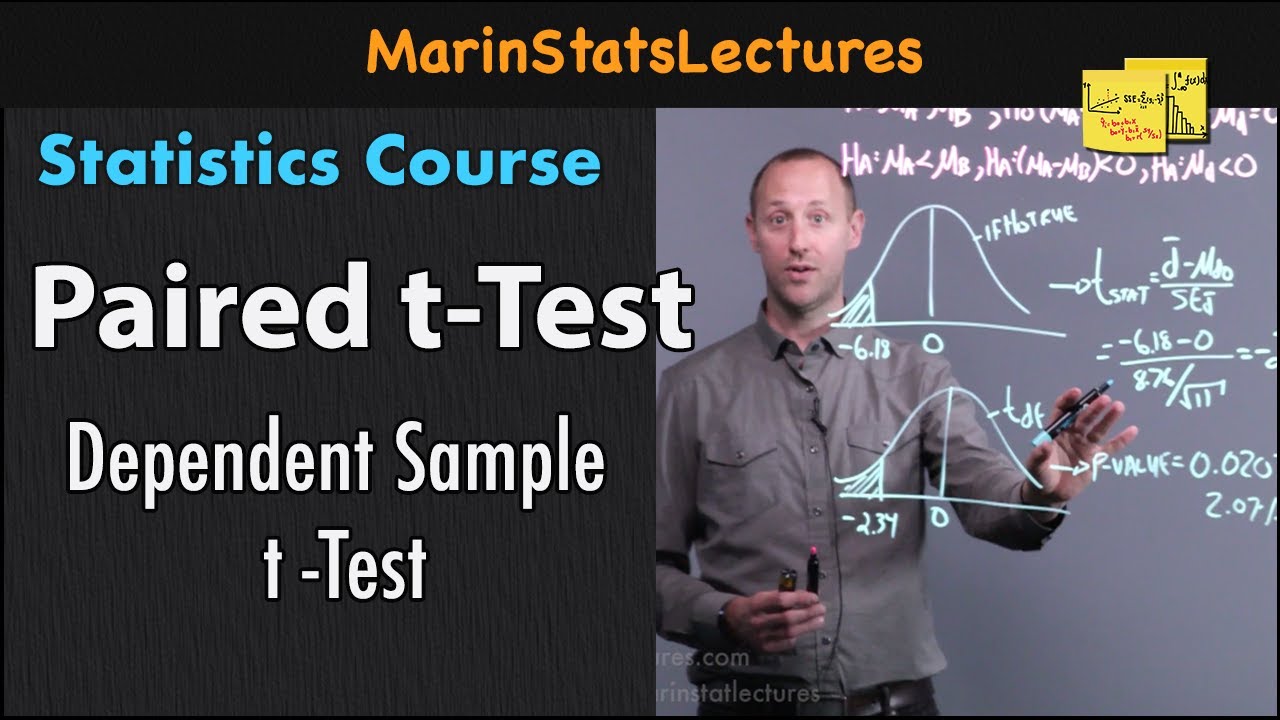
- 📚 The discussion focuses on the paired sample t-test used to compare differences between two related samples.
- 🔍 The paired sample t-test assumes that the data is normally distributed.
- ✅ A significant p-value (less than 0.05) indicates a meaningful difference between the paired samples.
- 📊 The speaker demonstrates the test using a case study of clothing purchases before and after a course.
- 🔄 The results show an increase in average purchases after the course compared to before.
- 🧮 The correlation value of 0.03 suggests a relationship between purchase frequencies before and after the course.
- ❗ A p-value of 0.033 indicates a statistically significant correlation, affirming the relationship.
- 📈 The final output indicates a significant difference in average purchases, with a p-value of 0.019.
- ✏️ Students are encouraged to practice with given exercises based on the paired sample t-test.
- 📞 The speaker invites students to reach out for assistance if they encounter issues with data analysis.
Q & A
What is the main topic of the seventh meeting discussed in the video?
-The main topic is the paired sample t-test, which is used to compare the means of two related groups.
What does a paired sample t-test assume about the data?
-It assumes that the data is normally distributed and that the paired samples come from the same subjects under different conditions.
How is the significance of the results determined in a paired sample t-test?
-The significance is determined by comparing the p-value to a threshold of 0.05; if the p-value is less than 0.05, it indicates a significant effect.
What are the two conditions being compared in the example provided in the video?
-The two conditions compared are the frequency of clothing purchases before and after attending classes.
What does a higher average frequency of purchases after class suggest?
-It suggests that students are purchasing more clothing after attending classes compared to before.
What correlation value indicates a relationship between the two paired samples?
-A correlation value of 0.03 indicates a relationship between the frequency of clothing purchases before and after class.
What interpretation is made if the significance level is 0.033?
-Since 0.033 is less than 0.05, it indicates that there is a significant relationship between the two samples.
What does it mean if the significance level from the t-test is 0.019?
-A significance level of 0.019 means that the null hypothesis is rejected, indicating a significant difference in purchasing behavior before and after class.
What action should students take after watching the video?
-Students should complete the exercises based on the paired sample t-test as outlined in the provided module.
What should students do if they encounter difficulties with the data processing?
-If students have difficulties, they are encouraged to communicate in their group for assistance.
Outlines

Dieser Bereich ist nur für Premium-Benutzer verfügbar. Bitte führen Sie ein Upgrade durch, um auf diesen Abschnitt zuzugreifen.
Upgrade durchführenMindmap

Dieser Bereich ist nur für Premium-Benutzer verfügbar. Bitte führen Sie ein Upgrade durch, um auf diesen Abschnitt zuzugreifen.
Upgrade durchführenKeywords

Dieser Bereich ist nur für Premium-Benutzer verfügbar. Bitte führen Sie ein Upgrade durch, um auf diesen Abschnitt zuzugreifen.
Upgrade durchführenHighlights

Dieser Bereich ist nur für Premium-Benutzer verfügbar. Bitte führen Sie ein Upgrade durch, um auf diesen Abschnitt zuzugreifen.
Upgrade durchführenTranscripts

Dieser Bereich ist nur für Premium-Benutzer verfügbar. Bitte führen Sie ein Upgrade durch, um auf diesen Abschnitt zuzugreifen.
Upgrade durchführenWeitere ähnliche Videos ansehen

KULIAH STATISTIK - ANALISIS T-TEST
Paired t Test | Statistics Tutorial #21| MarinStatsLectures
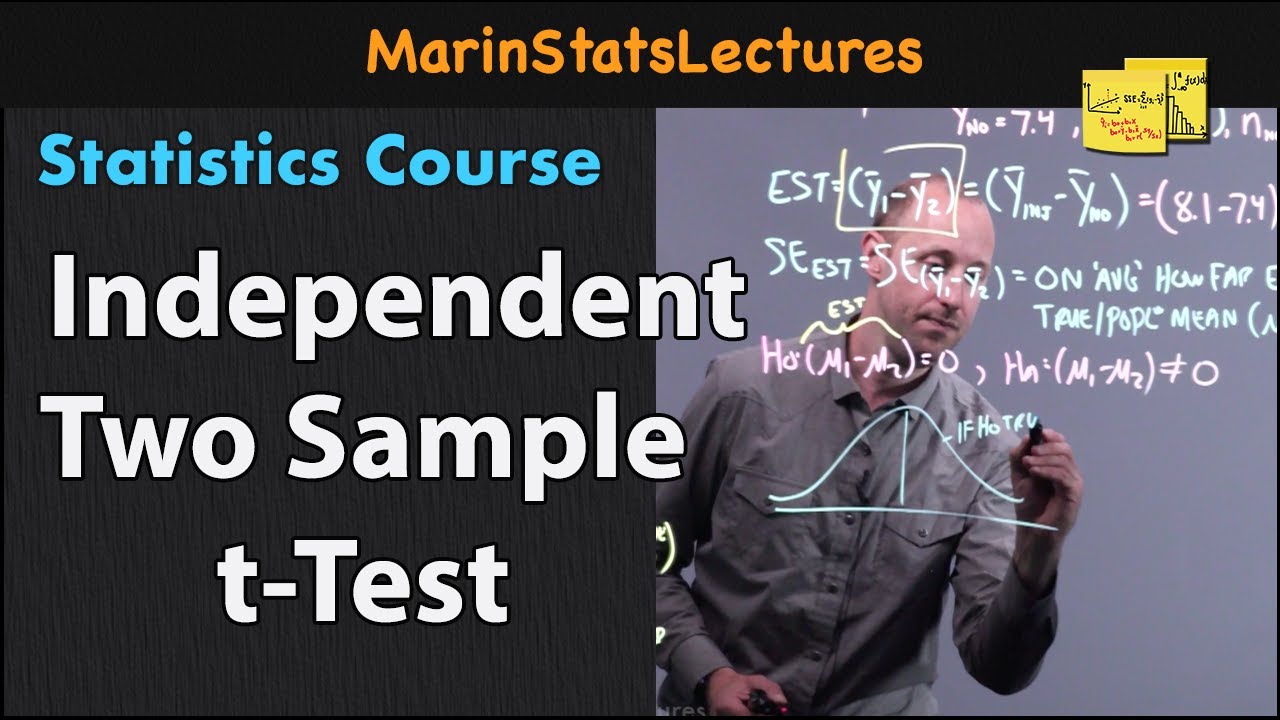
Two Sample t-test for Independent Groups | Statistics Tutorial #23| MarinStatsLectures
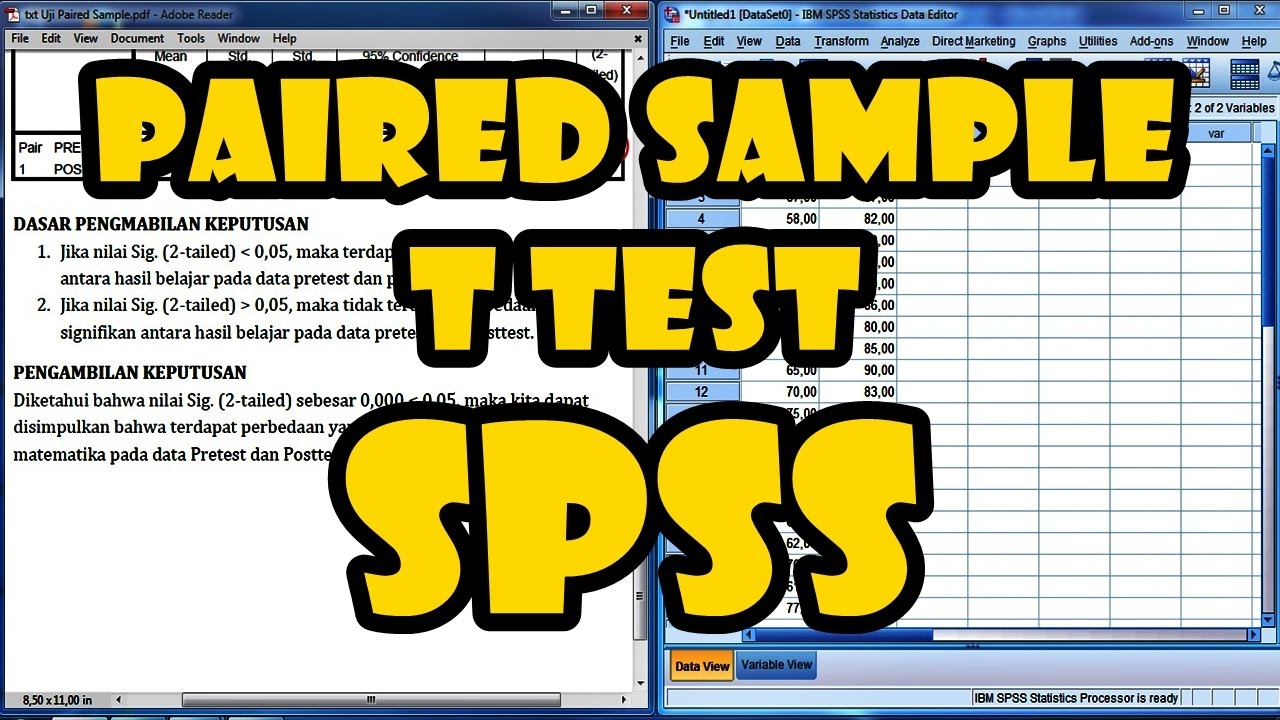
Cara Uji Paired Sample T Test dengan SPSS Full

uji beda rata-rata

How To Know Which Statistical Test To Use For Hypothesis Testing
5.0 / 5 (0 votes)
