Market Commentary 07 APR 2024
Summary
TLDRThe speaker discusses their trading activities over the week, highlighting the importance of understanding market maker models and price action. They emphasize the significance of identifying key support and resistance levels, as well as optimal trade entries and exits. The narrative also touches on the impact of news releases on market volatility and the benefits of focusing on a single asset and time window for more consistent trading results. The speaker concludes by advocating a disciplined approach to trading, suggesting that contentment with smaller gains and strict risk management can lead to long-term profitability.
Takeaways
- 📈 The speaker reviews their trades for the week, highlighting a mix of wins and losses.
- 📊 Emphasis on the importance of price action and understanding market behavior within specific time frames.
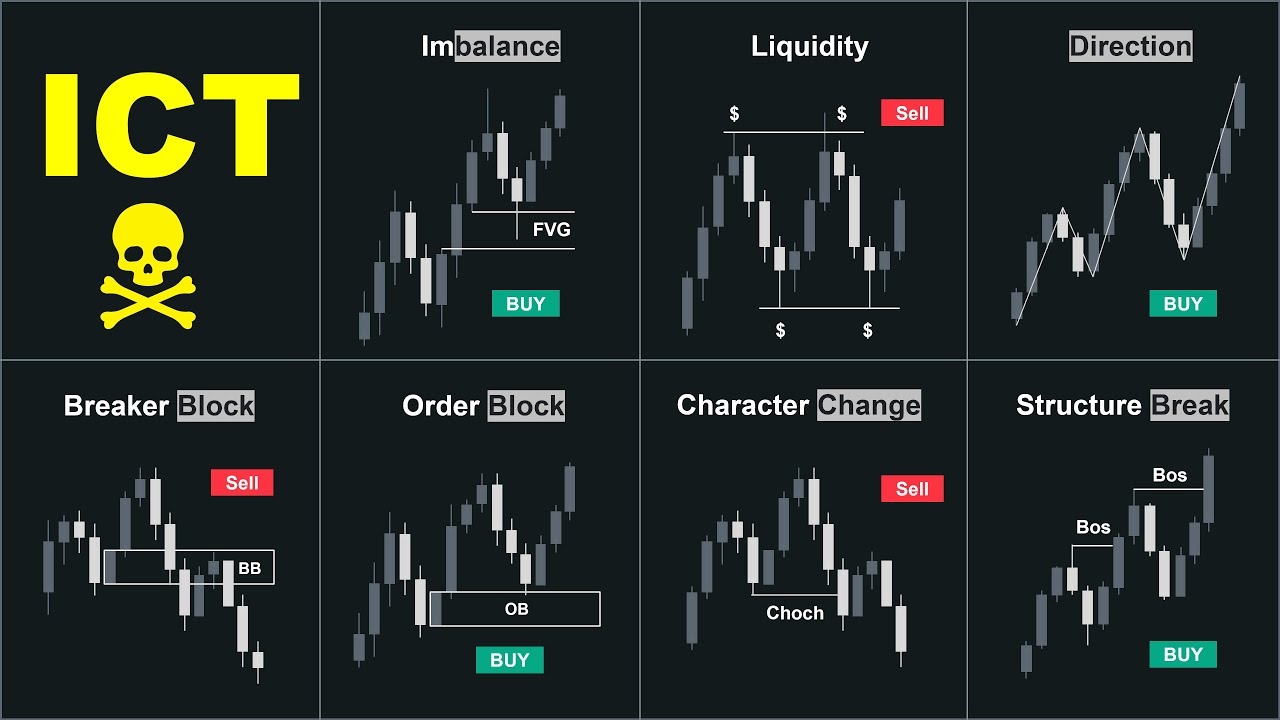
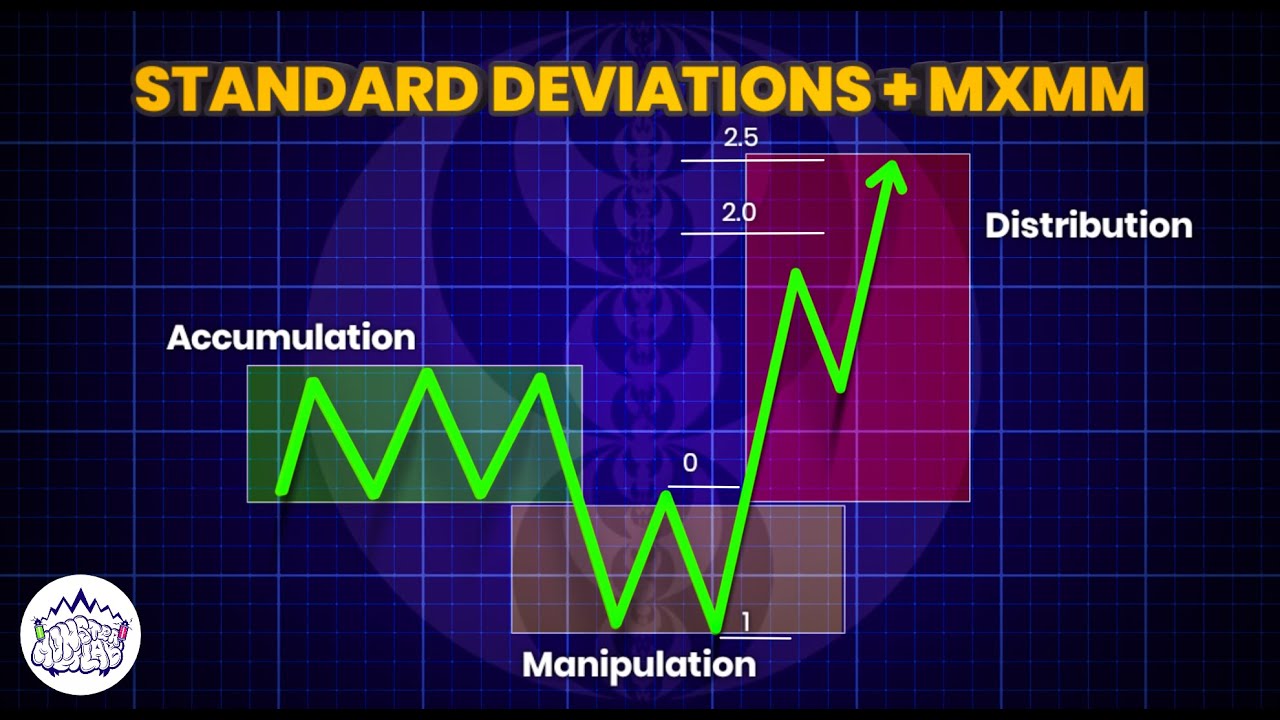
- 🛠️ Utilization of the market maker model to identify sell and buy sets of the curve for potential trading opportunities.
- 🔄 Focus on the reaccumulation area within the market maker model to predict future price movements.
- 📌 Identification of 'optimal trade entries' and 'return to equilibrium' points for high probability trades.
- 📈 'Bullish institutional order flow' is characterized by breaking highs and protected lows, using down close candles as support.
- 📊 The significance of volume imbalance and liquidity levels in confirming market trends and potential reversal points.
- ⏰ Timing is crucial, with news releases and market sessions like London and New York overlap being key for price movements.
- 🚫 Avoidance of trading high-risk events like NFP due to potential for significant losses in a short time.
- 🎯 Focusing on a single asset and time window can lead to more consistent results and less analysis paralysis.
- 💡 The importance of risk management, setting clear rules for when to engage, how much to risk, and taking breaks after wins or losses.
Q & A
What was the speaker's overall performance for the week in terms of trading?
-The speaker had a positive week in terms of trading, with two trades on Monday and Wednesday, one win and one loss. The other days, Tuesday, Thursday, and Friday, were also good.
What trading strategy was the speaker using based on the market maker model?
-The speaker was using a strategy that involved identifying sell and buy sets of the curve based on the market maker model. They were looking for reaccumulation within specific areas and projecting price movements from the sell set to the buy set of the curve.
How did the speaker analyze the market on Monday?
-On Monday, the speaker analyzed the market by looking at the previous week's down close candle, which indicated manipulation for the week. They were waiting for the market to complete the market maker model by expanding on Monday, which indeed happened.
What news-related aspect did the speaker mention as being important for market timing?
-The speaker emphasized the importance of high impact news for market timing. They mentioned that while they do not care about the fundamentals behind the news, the timing aspect is crucial for capitalizing on market movements.
What was the speaker's approach to trading on Tuesday and how did it differ from Monday?
-On Tuesday, the speaker observed that the market ran below Monday's low, filling the buy side imbalance. This was different from Monday's approach, which was based on the completion of the market maker model. Tuesday's trade was more about reversing the previous day's low and exploiting the new imbalance.
How did the speaker use the concept of 'bullish institutional order flow' in their analysis?
-The speaker used the concept of 'bullish institutional order flow' by looking for signs of breaking highs and protected lows. They used this concept to identify areas of potential accumulation and to confirm their analysis of the market's behavior.
What time frame did the speaker find most effective for identifying optimal trade entries?
-The speaker found the 5-minute time frame most effective for identifying optimal trade entries, as it provided a clearer view of price movements and allowed for more precise annotations and analysis.
What did the speaker advise regarding the approach to trading NFP (Non-Farm Payrolls) news releases?
-The speaker advised against trading NFP news releases due to the high risk of ruin. They mentioned that the volatility and liquidity issues during such events can lead to significant losses in a very short time.
What is the speaker's philosophy on handling losses in trading?
-The speaker's philosophy on handling losses is to be happy to take a loss because it means they are done for the day. They emphasize the importance of not being worried about losses and focusing on the long-term gains that consistent trading strategies will yield.
What advice does the speaker give for traders struggling with consistency?
-The speaker advises struggling traders to focus on one asset, one time window, and one strict approach. They suggest aiming for 20 to 30 pips during the New York session and being content with one to three good trading days per week.
How does the speaker suggest managing risk in trading?
-The speaker suggests managing risk by having clear rules and protocols for when to engage, how much to risk, and how often to expose oneself to risk. They emphasize the importance of controlling one's risk and not being overly fixated on the potential gains of each trade.
Outlines
📈 Market Analysis and Trade Review
The speaker begins by providing a brief introduction to their trading activities for the week, highlighting the weather's influence on their willingness to engage with the charts. They proceed to discuss specific trades taken throughout the week, noting the outcomes of each. The speaker then delves into a detailed analysis of the market maker model, explaining the sell and buy sets of the curve and how they project into each other. They also discuss the importance of news in influencing market movements and the identification of institutional order flow signs, using specific days of the week as examples to illustrate their points.
🕒 Timing and News Impact on Trading
This paragraph focuses on the timing aspect of trading, emphasizing the anticipation of news releases and their impact on market movements. The speaker explains how the market reacts to news, particularly high-impact news, and how traders can use this to their advantage. They discuss the significance of certain hours of the day, such as the New York session open, and how these moments can present optimal trade entries. The speaker also talks about the concept of 'breaker swings' and how they can be identified and utilized in trading strategies.
📊 Market Behavior and Optimal Trade Entries
The speaker continues their analysis by discussing the market's behavior in relation to support and resistance levels, as well as optimal trade entries. They explain how market manipulation can be identified through certain candlestick patterns and how traders can use these insights to their advantage. The paragraph also touches on the concept of 'fractal lows' and 'fractal highs' in the context of the 50-minute chart, and how these can be used to identify potential trade opportunities. The speaker provides a detailed walkthrough of how to identify and act on these opportunities, using specific examples from the market.
🌐 Understanding Market Maker Models
In this paragraph, the speaker delves deeper into the understanding of market maker models and how they can be used to predict market behavior. They discuss the concept of 'distortion of time' within these models and how it can be observed in the market's price movements. The speaker also talks about the importance of recognizing buy and sell days, and how these can be identified through the market's daily, weekly, and even 15-second charts. They emphasize the consistency of logic across different time frames and how this can aid in generating wealth through trading.
📉 Analyzing Market Swings and Trade Opportunities
The speaker provides a detailed analysis of market swings, focusing on how to identify and take advantage of trade opportunities. They discuss the manipulation of the market in different sessions, such as Asia, London, and New York, and how these can be used to predict future market movements. The speaker also talks about the concept of 'redistribution' and 'reaccumulation' within the market, and how these can be used to identify potential trade entries. They provide specific examples from the Euro market to illustrate their points and offer insights into how to effectively target and manage trades.
🔄 Support and Resistance Dynamics
The speaker discusses the dynamics of support and resistance in trading, explaining how these concepts can be used to identify entry and exit points for trades. They provide a detailed analysis of how the market's movement can be influenced by these factors, and how traders can use them to their advantage. The speaker also talks about the importance of managing risk in trading, emphasizing the need to set appropriate stop levels to protect against potential losses. They provide specific examples from their own trading experience to illustrate these points and offer advice on how to effectively manage trades.
📉 Reflecting on Trading Strategies and Performance
The speaker reflects on their trading strategies and performance, discussing instances where they may have misread the market or failed to capitalize on opportunities. They emphasize the importance of flexibility in trading, explaining how being too fixed on a particular idea can lead to missed opportunities. The speaker also talks about the risks associated with trading certain events, such as NFP, and why they choose to avoid these. They provide a detailed analysis of their own trading behavior and offer insights into how to improve consistency and profitability in trading.
🎯 Focusing on Consistent Trading Opportunities
The speaker discusses the importance of focusing on consistent trading opportunities, emphasizing the need to target specific pip levels and stick to a strict trading approach. They explain how aiming for smaller, more achievable targets can lead to greater consistency and profitability in trading. The speaker also talks about the benefits of limiting the number of trades and focusing on quality over quantity. They provide a detailed breakdown of how to identify and execute these trades, using specific examples from the market to illustrate their points.
🚫 Embracing Losses and Managing Risk
In the final paragraph, the speaker emphasizes the importance of embracing losses as a natural part of trading and managing risk effectively. They discuss the need to have clear rules and protocols for engaging in trades, including how much to risk and how often to expose oneself to risk. The speaker also talks about the psychological aspects of trading, explaining how to maintain a positive mindset after losses and how to be content with wins. They encourage traders to focus on the long-term benefits of their strategies and to enjoy the process of trading.
Mindmap
Keywords
💡Market Maker Model
💡Price Action
💡Reaccumulation
💡Volume Imbalance
💡Bullish Institutional Order Flow
💡Fractal
💡Breaker Swing
💡Optimal Trade Entry
💡Liquidity
💡Risk Management
Highlights
The speaker reviews their trades for the week, noting one win, one loss, and good performance on other days.
They discuss the market maker model and sell set of the curve, explaining the concept of reaccumulation within a specific area.
The importance of projecting price action from the sell set to the buy set of the curve is emphasized, along with the use of arrays.
Monday's market manipulation is described, highlighting the down close candle as a key indicator for the week's trading strategy.
The speaker explains how Tuesday's trade filled the buy side imbalance, leading to a higher trend.
A detailed analysis of Wednesday and Thursday's price action and the impact of a bank holiday on trading is provided.
The completion of the market maker model is discussed, with a focus on the gap higher fill and the resulting high volume imbalance.
The definition of bullish institutional order flow is given, with an explanation of breaking highs and protecting lows.
The speaker annotates a down close candle, emphasizing its significance as support and the relevance of volume imbalance.
A discussion on the importance of news timing in relation to market movements and the anticipation of price reactions.
An in-depth look at the 1-hour time frame, highlighting the impact of high impact news and the resulting market shifts.
The concept of optimal trade entries and returns to equilibrium are explained, with a focus on identifying key support and resistance levels.
The speaker provides a strategy for trading the New York session, emphasizing the 7 to 10 a.m. time frame as the most active for price movement.
A detailed breakdown of how the market gaped and ran, waiting for news drivers to inject volatility and propel price in one direction.
The speaker discusses the quiet period in the market from 3 to 8 p.m., noting the typical lack of volatility during this time.
A strategy for taking profit is outlined, focusing on understanding the market's daily profile and targeting key price levels.
The concept of market maker models and the distortion of time within price action is explored, highlighting how price can consolidate before moving quickly.
The speaker shares personal trading experiences, discussing the importance of flexibility and the pitfalls of being too rigid with a trading idea.
A final strategy is presented for focusing on one asset, one time window, and one approach, aiming for a few high-quality trades per week.
Transcripts
what is going on guys welcome back to
another quick commentary today is going
to be a short one because weather is
great and I really don't want to be at
the charts however I want to review the
trades that I took this week and was
actually pretty nice price action took
two trades Monday and Wednesday one win
one one loss and the other days Tuesday
Thursday Friday were good as well
and
Monday was this here we were in that
market maker model okay this is sell set
of the curve buy set of the curve as I
explained in the previous commentary if
I zoom
in that I was looking for reaccumulation
inside that area Okay because high to
low that is your sell set of the curve
and now you project everything into the
buy set of the curve which is low to
high and you combine it with arrays that
you have in the biset the curve so those
up close candles from the cell set of
the curve give me a Range I expect
accumulation inside that range and I
overlap it with there is a buy set
imbalance over here in the Bice set of
the curve and Monday from previous week
printed a down close candle which is
beautiful okay because that's the
manipulation for the week and then
Tuesday runs below Monday low fills that
imbalance and that buy side imbalance
trades higher Wednesday creates a fra
low Thursday and Friday is one
Candlestick over here because it was a
bank holiday and then the markets were
even closed on Friday so that's what
happens okay it gapped higher filled the
Gap ran a little bit but there was no
move yet formed the high at that volume
IM balance over here but obviously where
was it drawn to the buy sell liquidity
above that high to complete the market
maker model so that expansion on Monday
really was just the move to complete
that buy model and like if you look at
this here the market was waiting for
something what was it waiting for as
always news okay because we don't care
about the fundamentals behind the news
we need the timing aspect so what we do
have here is a down close candle and the
buy set of the curve so remember
definition of bullish institutional
order flow it is breaking highs yes
check okay lows are protected not rating
the lows down closed candles act as
support look at this down closed
candle and we're going to annotate
it the entire body essentially you can
use high to low but mainly focus on the
bodies okay there's also that volume
imbalance not going to annotate it but
that's also relevant and obviously the
drawn liquidity is the high over
here it created that fra low okay it is
respecting buses so all our
institutional aut flow signs go green
okay busy down here another busy over
here so a of low bullish our
accumulation range last week Tuesday
formed the low Wednesday Thursday Friday
started the move but it hasn't reached
the objective yet so what was it waiting
for let's jump into a 1 hour it was
waiting for the high impact news 10:00
a.m. on Monday okay and that green box
of obviously is the Monday candle from
previous week so this is also a weekly
open okay which is a new week opening
Gap Friday close and Monday open Tuesday
traded below Monday low so this is the
reversal okay displacing
here breaking above highs so this was
the
shift okay low high lower low breaking
above that high shift
displacement inate that
busy right so UT flow bullish finding
support at that busy running higher on
Thursday snapping back into the range
trading back into the new week op or New
Day opening Gap from that day trading
higher and then look at that CBI okay if
it's bearish you want to see it collapse
from there if it trades above it's going
to turn into support So trade higher
here this was the Sunday open so there
was a new week opening gap which is
another confirmation that price is in a
hurry to get somewhere if we have a new
we opening Gap okay Sunday to Monday
then I really like the Monday New York
session especially if there are New York
high impact news and what we got here
was the new week opening Gap the ASI
session traded once more into the order
Block in form of previous week's Monday
down close candle okay and snap back
consolidation during London why because
we had high impact news in New York so
again the market is waiting for that
news release okay and then 6: a.m. 7
a.m. starting the move essentially 6:
a.m. if we zoom in on that day 7 a.m.
that's what you always want to look at
because that's your New York session
open trades lower finds a discount where
at that oil block that 1 hour
Candlestick essentially if you annotate
the open and I'm going to delete this
this if you annotate the high and the
open like this in lower time frame frame
you will notice that if we jump straight
into a 50
minute okay this is your breaker swing
because there's a low it's a high it's a
lower low and it breaks above with faue
gap so this here is your breaker swing
and you don't expect it to trade below
London low because there already was
manipulation during London okay Asia
manipulated traded higher another
manipulation here during London traded
higher and there is displacement
overlapping with the breaker if you go
into a five
minute okay the candles look cleaner
then I would choose this candle here as
a f minute breaker because cell side
taken here okay displacing them above
that high so this is the support
resistance that Works breaker swing so 7
a.m. trading lower one
manipulation
7:35 finds the low of the session
trading higher 5 minute order block re
accumulating at that inversion level
from the 5 minute order block which is a
balanced price range because there is a
busy as well okay and then 8:00 a.m.
immediately starting to this place
there's 900 a.m. so I'm going to
annotate the 9:00 amm
open and now picture the 9:00 amm candle
okay what does it do there's the open
there's a run higher it makes a low it
runs higher optimal trade entry running
higher optimal trade entry optimal trade
entry running higher boom and the close
so what I just pictured is this here
because this here is the 9:00 a.m.
candle and this here is optimal trade
entry number one
this here is another optimate trade
entry this here is another optimate
trade entry this here looks like a
return to Discount okay 945 shooting it
higher creating a new
busy dipping into it creating two down
Clos candles and then finally obviously
10:00 a.m. which just sends it higher
because there was the high imp pick news
release okay so 700 a.m. creating the
low of the session at a 5 minute breaker
8:00 a.m. immediately displacing what is
here busy and a volume imbalance so
where does the 9 a.m. candle find its
low at that busy right and from there
there's many optimate trade entries in
the lower time frame basically those are
one minute optimate trade entries you
don't have to go into those time
frames if you stay on a 50-minute chart
5 minute chart you see this all
just to give you the logic behind it
we're simply looking at that 9 a.m.
candle 9 to
10 okay there's low to high optim trade
entry number
one return to equilibrium here optimal
trade entry number
two
return to equilibrium again
here oops okay and then it sends but
just to show you there are many optimal
trade entries and if we go back into a
50-minute
chart okay all you need is that buy side
imbalance cide inefficiency if I delete
everything busy
busy okay so if you trade the New York
session there's 7 a.m. 7 a.m. Judah
swing that's your busy it's not going to
trade below that low if it's LED because
what you expect is an optimate trade
entry or return to equilibrium of that
range
okay doesn't have to trade to
equilibrium okay because it traded into
that breaker but you expected to respect
that buy side imbalance on the 50-minute
chart over here creating two down Clos
candles displacing higher again so what
you now expect is an optimal trade entry
from this
low this is a fractal low in the
50-minute chart fractal
High it trades to equilibrium but again
you can easily enter here you can easily
enter in the premium you can you can
enter inside that down Clos candle okay
it's not about you have to buy the
discount important is that your stop is
at least below that candle or below that
candle like my stop I would have placed
it below that candle giving it room to
touch that order block to fill in the
faue Gap okay but if your stop is down
here then you're covering the entire
discount so you can enter in the premium
but your stop has to cover the array you
cannot like buy here and put your stop
inside that fa Gap okay so yes you can
buy the premium but your stop has to
remain at the place that invalidates the
idea and if you make it if you want to
make it simple then simply always put it
below the low okay expect a 15-minute
optimate trade entry 15-minute return to
Discount and put your stop below the low
in the New York session what you then
see is look the market starts
gapping and this is something Larry
Williams anotated or already noticed
back in the
70s okay like look how it starts
gapping not really gaps down here okay
but all of a sudden it starts gapping
and really begins to run in One
Direction and 10: a.m. is just it's
waiting for that news driver for the
volatility injection to to just run it
higher in One Direction okay to to send
it because that's the perfect excuse no
one is questioning the news release oh
it was good for dollar Index haven't
even checked the numbers because we
don't care about the numbers right it
was in price prior to the release and if
you look at the entire
day when that the high of the day form
this here is 12 so look how picture
perfect it formed the high of the day
during
lunch so 10:00 a.m. to 12: is lon close
so you want to take profit in
here okay till lunch and look what
happens
three 28 look how quiet it is here
because 300 p.m. is the bond market
close like all the currencies they they
go really quiet after 300 p.m. because
the bond market is closed
okay and then eight starts the Asia
session that's where you typically get
some volatility but it doesn't has to
okay like it it can stay in in a
consolidation during Asia but typically
3 to8 is really really quiet it's like
the de zone for the day majority of your
highs of the day will form during lows
long and close and if we look at the
entire
profile Asia created the low
reaccumulation in London reaccumulation
in New York on close high of the day
going back into consolidation so you
don't even have to look at all this aan
London I don't trade it you don't have
to trade it because if you enter the New
York session okay here at 7 a.m. oops
you ask yourself okay what did London do
there was manipulation in Asia and there
was manipulation in London so
London traded into equilibrium of that
range Asia low to London High okay Trad
it into equilibrium and then this is the
important part displace the W from it
giving
you that buy side imbalance over here
trading into that buy side imbalance
displacing again back into that
displacement leg displacing again so
that's the benefit of trading New York
session that you always see what did
what did London do Okay and like the
classic regardless what you do on a day
regardless where you take a win or a
loss if in hindsight the day is
something like London creates a low in
these places and New York makes a
reaccumulation in the same direction
regardless whether you lost on that day
trying to long it in New York or whether
you went short like you just lost on a
classic by day profile those are the
losses that that you really want to
study because this is your bread and
butter if if you can identify those
classic buy and sell days once a week
you have everything you need to generate
wealth that's
it
because that's what typically happens
typically London creates the low of the
day in this case yes a session creates
the low however London created a low and
New York offered a reaccumulation in the
the same direction as London displaced
already so what we had here was a London
displacement
swing okay London creating that low at
equilibrium displacing higher here New
York session power of
three really just look at 700 a.m. to 10
because that's really your
your hot spot for the day 7 to 10 8 to
10 that that's the mean threshold of the
entire day why because that's the
overlap of New York and London London
closes at noon so essentially in between
7 to 10: is your real New York session
and then 10 to 12 is your close but if
you look at 7 to 12 for every day on
this day there was the 7 opening seven
opening small Judah swing lower
displacement re-entry at busy
okay lots of small volume imbalances to
then wait for the news and to send it
higher so that New York session offered
a
beautiful power of three Judi wing for
the day displacement this entry right
here this one this is the one you want
to catch that's the lowest or the
highest probability entry you can
catch that's really low hanging fruit
because it is already displacing in One
Direction the flow is
already in that direction it is already
ongoing you don't have to predict any
turning points you just follow the
existing
flow and you know where it is drawn to
because again on the
daily by set of that high to complete
one market maker model daily flow
clearly been
bearish and then you buy a 50-minute
busy during New York entry one entry two
so Monday offered a beautiful classic
buy day what is your near-term
draw simple isn't
it previous day
high so if you buy New York session your
entry is most of the time if you G but
your exit is always if you long
obviously either a cian price but I'm
only talking about the liquidity now it
is either previous day high it is London
high or it is the AI session high and
obviously it can be as much as for
example previous week or previous month
high but this is not what you frame your
intraday idea around back to the
Daily this here is the high of February
so this was already April so in April
you targeted on that Monday you targeted
February High you targeted 224
High however your entire
trade was based on the logic you target
previous day
high your trade is this you buy that
busy and you want to Target
previous day
high this here is your
trade and the more you understand about
Market maker models the more you see the
nature of the fractals this over
here is a reversal this over here is a
redistribution this over here is a
reversal this is a
reaccumulation and this is what you have
to understand is Distortion of time it
goes sideways but it is still inside
that market maker model look how much
more time it spends here in comparison
to how quick it went down here this is
Distortion of time once you see that
Distortion in price and ICT said this as
well when he realized there is
Distortion in time it's always the
market maker model but it can be there
is simply Distortion in time it can look
like this that it takes a long time to
move away from one price level but it
doesn't change the overall Market Mak
model it is inside that cell side and
this is buy set of the curve and that
buy set of the curve can take three
times as long or even more than the cell
set of the curve why is that time here
why is is it
distorted why simply because price is
waiting for that news release over here
so it reverses here and then goes into
consolidation everything it did here not
relevant you don't have to look at PD
arrays inside that consolidation
whatsoever it goes sideways here starts
expanding here just ahead of the news
and now look for the magic what is this
redistribution that is Thursday New York
session isn't this cell set of the curve
is that what I just said right so what
if we now project those two down Clos
candles
into the buy side of the
curve Monday New York session
reaccumulates a busy in
price
inside that distribution from Thursday
which was essentially the last day of
previous week's trading because there
was no Friday
trading so that New York session is
using that New York session as
mitigation this is what you have to
understand about mitigation if they sell
it here for that New York session their
entries is
here and if it breaks above they get the
chance to mitigate their position to get
out of
it trades above with displacement trades
back into it so they can get rid of
those trap TR
positions
Market maker
model sell set of the curve projected
into the buy set of the
curve and if it works on a 50-minute
chart it works on a daily and it works
on a weekly and it works on a 15sec
chart it's is always the same
logic so looking at
Euro Monday
right we had manipulation in Asia took
out the buy stops over here trading
lower London trading back
into probably equilibrium of the range
trading lower up close candle
displacement lower up Clos candle
dropping lower up close candle and then
it finally melts lower what is the
entire IDE frame round what is this
previous day low so what do you do you
sell the New York session and you target
previous day low what I did was that
Candlestick over here I went short
inside of it that's a a change of this
to
premium and those are advanced concepts
right but the equilibrium of that order
block mean threshold like if you would
have gone long okay see this as an order
block 50% of it look how it breaks below
it and turns the mean
threshold into
premium and then it melts lower to
attack this The Narrative is what is
decisive and then if you zoom
in what you can see over here is that
small busy
INF right because that swing higher here
look at the
cbies when higher to fill in that
c also to trade back into this as an aut
block this was 7: a.m. so what you have
here is
your I'm going to make this maybe like
this what you have
here is an optimal trade entry 7:
a.m. and this here is obviously a return
to equili
from the London from the 7 a.m.
high this High here filled that Cy and
also traded into that inversion level
from that 15minute busy over here but
ICT taught us if it fills a fair value
Gap this makes this High automatically
an intermediate term
High took buy stops over here broke
lower now look at this down close candle
here see that high there's no fr low see
that higher high it ran above that high
that candlestick's low if you go into a
5min chart is a
breaker because in a f minute chart you
have that displacement retracement Buy
sell liquidity run drop below and that's
the support resistance that works
again so my entry was dead Wick here
sold it here sold that inversion level
with a stop simply above that high
essentially giving it
room especially if you're selling you
want to give it more room to to stop
because then you can get spread out if
you long you can't get a spread out at
your stop that's just the nature of the
market that you have to if you long you
have to calculate the spread on the
entry especially if you use a limit
order however I was expecting it to turn
that low okay that 500 breaker into
resistance but enter early like one two
Pips doesn't make a difference same
trade okay make sure that you get into
the
move and 818 by the way was my exact
entry I remember it okay and then it
spent here for an entire spent time like
an hour at my
entry and this is where
you really have to go through the data
because if you don't really know what
you're looking for if you don't really
know the model then you start to second
guess everything in that hour you look
for every Dan why this trade isn't good
anymore oh it took the sell side over
here and now it's going to reverse okay
and in an hour you can have a lot of
thoughts so it's easy to collapse the
trade inside that waiting period but
what is price really waiting for
essentially the 10 10: a.m. news right
8:00 a.m. doing nothing 9:00 a.m.
starting the move 10:00 a.m. running it
lower aggressively okay and just
dropping it into the close excuse me at
12 p.m. okay so Monday was really nice
delivery one more re-entry essentially
just ahead of the news but again your
main target is previous day low that's
your entire
idea
so let's go back to the
Dixie shot higher
Tuesday took out Monday High dropped
lower you trade London
session this is your London optimal
trade
Entry New York session trading
higher essentially into that down close
candle over
here not really clean for me but it it
delivered so in hindsight it was always
clean that's how you have to look at it
I remember I had that CBI annotated on
in price and and trade into it and from
there it simply staircased lower and
used every up close candle as n block to
sell it off so they're definitely where
selling opportunities on that day on
Tuesday your target would have been to
rebalance that displacement from the
previous day session look at the 1 hour
fa Gap that is inside here okay but look
where it forms the newor session low
filling in that busy from previous day
news
displacement next day we had a
session London forms the high of the day
here taking out
Asia optimal trade entry but entry
during London lunch right selling
off there's your
displacement okay the
CBI and there's your New York optimate
trade entry and that's the day I simply
read wrong okay was bullish on that day
tried to long it if I would have waited
long longer than I might have caught the
the dollar Sals but I was preoccupied on
that day and this happens happens to the
best really I was expecting Longs I
wanted to see Longs I was only waiting
for Longs and I kind of ignored the
short side I saw this as a potential
premium but I expected it saw the new
day opening Gap to break above this and
to turn it into support
So this happens I just completely read
it wrong on that day ignored the fact
that this was a beautiful optimal trade
entry into CI into inversion level it's
a beautiful selling opportunity with the
benefit of hindsight but what I saw was
for example if we go into
Euro on
Wednesday and many took this trade it
took equal highs right high low higher
high breaking lower so this here was
definitely a valid short but like the
cleanest sell model will not work if it
is in a buy program okay if it wants
higher because what it did is optimal
trade entry from this range okay but
obviously from a selling perspective we
had a balanced price range over here so
it took buy stops again clear to equal
highs okay so you could have expected
okay high of the day in and now sell it
off attack this as low resistance
completely read it wrong on that day I
tried to sell
pound in hindsight I talked a lot with
Nico about our gu loss um wasn't wasn't
really great performance because as I
said I was preoccupied I was too rigid
with that idea and I was
too too fixed on it okay I kind of lost
the flexibility of seeing the counter
side I went into the session or I want
to sell pound and I'm not regret rting
my choice because it it happens it
really happens and on for example on
Tuesday I thought Let Me Wait that day
and I'm going to sell pound tomorrow so
I sold pound on Wednesday and I had that
plan since Tuesday so it wasn't
something completely irrational but I
was too fixed on that
idea and I was only looking for this and
if I would have been more flexible then
I might would have seen the other side
and I might would
have seen that one hour order Block in
di Dixie over
here okay which it traded into perfectly
plus there was a 1H hour inversion
level so that was clean as hell okay but
I had blinders on on that day and I
missed that Wednesday opportunity and I
I got it wrong because I tried to sell
pound But ultimately what happened with
was the draw this is previous week low
and previous week low is
also the open of the weekly fair value
Gap so that is a market maker sell model
obviously right so again trades into the
order block at 8 there's nine and 10
just gapping lower collapsing
completely
Thursday collapsing it okay there was
another 20 pip swing for Euro for
example example with the 830 news to
complete that cell model low re-entry
okay to attack that and then It reversed
trading above that Candlestick
here as a breaker plus F Gap displacing
away so this is now an order
block if it would not have been NFP then
I would have bought that okay but I
trade don't trade ahead of NFP because
you can really be aggressive for example
if we go into a 5sec
chart and go back to 830 look how it is
[Music]
running like okay this is dollar Index
but 30 points in dollar if we look at
this in
Euro there's a 5sec
chart there's 8:30 release So within the
first 5 Seconds it dropped 30
Pips if I have a 10 pip stop I'm not
going to get out here like it will get
into the loading screen and they will
try to close my position but I will get
my close somewhere down
here and like if you look at this
everything in here is the first minute
of NFP drop so that's the risk that
comes with it so 35 pip if I enter with
an 8 pip stop whatsoever that can be
like a 1% loss can easily turn into a 4%
loss so this is just too much risk of
ruin this can kill my account that's why
I don't trade it like 30 Pips within 5
Seconds that's aggressive that is really
aggressive and you have to see it like
this your broker broker is going to have
liquidity issues so everyone wants to
fill okay because you're not the only
one who's getting that stop so it really
and they are allowed to do so they will
hold you and will get you out of that
trade as soon as they have counter
liquidity and this might all might only
be down here okay so this can really be
brutal if
you get trapped on the wrong side of
moves like this this is why ICT taught
us don't trade NFP don't try try to
trade CPI okay because risk of maren is
simply too high however we got that shot
lower there was smt Divergence as well
Euro took London High and the Asia high
and dollar obviously stood below gu is
still below as well we got that shot
lower and I wasn't at the charts later
on but if you go into a 5 minute
chart there's the 5 minute order block
okay from which it accumulates higher
this here is essentially your inversion
fa value Gap so potential re-entries I
could have imagined would have been
something like this okay that would have
been valid for Me Maybe trading back to
consequent encroachment coming back into
that order block for mitigation
essentially busy number one busy number
two so the aggressive way yes this here
was an optimate trade entry that
definitely had reason behind it however
I wasn't at the charts anymore what
could you have targeted to fill in that
CBI that yeah
basically um like it it just melted away
okay to fill in that c cread with NFP
look where it forms the high post NFP he
filling in that's really like a gap for
the market because it is so aggressively
offering in one side not offering the
other side it wants to rebalance that
and that's what it did later on so that
was NFP but I typically don't like to
trade Friday and NFP Friday basically
the only exception when I sometimes
trade also notice for example if we go
into one hour chart or like like 50
minute chart where did NFP sell off what
was it targeting look at
this from
Wednesday okay so Monday sold off
aggressively what would would have been
your Target on Tuesday you could have
targeted the inefficiency created with
the Monday New York news displacement
right that could have been your Target
on Tuesday Wednesday shot higher
Thursday continued higher what could
have been your Target on Friday that
this placement from the Tuesday a
Wednesday New York session okay so when
you target you always Target sell
liquidity London low and bus in price
and look where touchdown it forms the
low at the low end of that busy so
that's clean delivery okay but there was
no clean re-entry over over
here however as mentioned on the 5
minute chart here this here potentially
that was an entry and I would say that
was
leged
right
so with this being
said I think I covered everything I
wanted to say um definitely if you see
it like this Monday offered opportunity
Tuesday offered opportunity Wednesday
offered Thursday offered and Friday
offered I'm going to give you a speedrun
on the 5 minute
chart
by giving you 10 to 10 pip
place okay you would have bought
here that busy as
entry going to go into a 3 minute for
Thursday that's what I tape red but
didn't
trade took out the cell side
here busy here so that was the 8:30
news simply targeting London
high back into a five minute
5 minute
breaker plus
busy 10 pip
stop Target and 10
Pips
Tuesday smt Divergence here with the
dollar
Index
accumulated
higher could have bought into that Wick
10
pip where is it drawn to you want to
fill in that displacement from
Monday and you can go for 20 Pips here
but the reason why I showed you this is
just to prove there's something every
single session looking at
Monday
5 minute inversion faue
Gap going for
101 Okay the reason why I suggest those
trades is not
because you only have to go for 10
Pips but those are the same tra
that 10 pip Target here could have been
a
10r and what I suggest you is look for
20 Pips in New
York because every single opportunity
every single
day there are
moves if you know what you're looking
for and if you can catch one 20 pip
swing a
week that is everything you'll ever need
and this here
should show you that if you're having
difficulties finding
consistency focus on 7 to1 8 to1 one
shot and done go for two three R because
if your wins give you three R can lose
70% of your trades and you're still
profitable no re-entries no 1%
risk on every trade one shot and done
for today regardless of what outcome you
get loss done win
done
focus on two three shots a week focus on
getting one winner a week because that
already means your week is
blue try to average maybe 10 to as as
much as 15 trades a month if you have 10
trades a month if you have three winners
averaging 2.5 maybe up to
3% then you are Break Even or profitable
for the month if you have a quarter with
let's say 30 or even up to 40 trades you
have 30 trades and your wins average
three R you lose 20 of it you win 10 you
lose minus 20 you make 30 so your
quarter is up
10% and now do the math with whatever
account you're comfortable or even
picture you managing a million trading
half risk making 10 r on it and all of a
sudden you make 50 Grand a
quarter and that's not even the limit
so re-evaluate if you really have to
trade London and New York and this and
Euro and SPO and NASDAQ and or if it
might be smarter to commit to one asset
time one time window one approach
hunting 20 to 30 Pips during New York in
Euro USD having a one shot one kill
policy expecting two to three good days
a week having the expect expectation of
maybe catching one of those moves being
willing to miss two three moves a week
being willing to have two three no trade
days a
week limiting yourself to maybe one to
three executions a
week calling it a week if everything
goes south and you have three
losses calling it a week after two wins
maybe you're even calling it a week and
if you're not consistent that's the best
you can do after just one
win catching your win on Monday and
being content observing the entire other
week observing wow Tuesday delivered
again 20 Pips Wednesday delivered again
20 Pips Thursday delivered again Friday
delivered again and regardless whether
you trade NFP whether you trade or took
that long or whether you even saw that
long or whether you are like me and sold
that day because you were
preoccupied seeing in hindsight well it
was
there that's how you lose that fear of
losing it's there every single day you
have to put your blinders off and you
have to study it with that perspective
there is something every single session
if you go for 10 20 Pips during New York
8 to 11 there is something for you every
single session the problem you're having
is you W 50 Pips 70 Pips 100 Pips and
every trade that doesn't offer 100 Pips
is not a good trade to you if it only
runs 30 Pips in your direction that's
not a good
trade you're going to have immediate
losses you get in and it's going to
immediately run to your stop and you're
going to have trades that run
immediately into
profit or they're going to chop around
for an hour and then maybe go to stop or
profit that's all the things that you
cannot control you can control how much
you risk and how often you expose
yourself to risk that's the reason why
you need rules protocols for when do I
engage how much do I risk how often do I
risk as I just said in the previous
couple of
minutes it might be smarter for you to
focus on one asset one time window one
strict approach write it down what are
you going to do which which asset are
you going to trade when are you going to
trade how much are you going to
risk write down after a loss I
immediately call it a day after a win I
immediately call it the day like I'm
going to end it with this I really like
taking losses because they mean that I'm
done for the day that I can close the
charts that I can enjoy life because let
me tell you this I don't trade for the
sake of taking
trads I trade for the
freedom and you should too so be happy
to call it the day after loss be happy
to be content after win be happy to
close your charts because regardless
whether you suffered ruin or not in your
losses the market will tick tomorrow
again and they will next week and they
will next month and all the you
learn today will deliver in a decade
from now there's no reason to be worried
about this is your million dollar ticket
really you have
it try to do less and you will end with
more with this being
said enjoy the rest of your weekend
trade safe and talk to you next week
peace
Weitere ähnliche Videos ansehen
Do This Before Work Everyday to Make Easy Money ($250/Day)
The 3 step Price Action Trading Strategy ONLY Top 5% use...
ICT Forex - Market Maker Series Vol. 4 of 5
Time Trading Made Simple
Stop Waiting for Pullbacks, Use Market Maker Models Instead (ICT Concepts)
Trading with $10 to Prove it's Not Luck...
5.0 / 5 (0 votes)