Graphing a line given point and slope | Linear equations & graphs | Algebra I | Khan Academy

Khan Academy
8 Jul 201902:10

Summary

TLDRThe instructor guides students through the process of graphing a line with a slope of negative two that passes through the point (4, -3). The lesson emphasizes understanding the slope by demonstrating how the line can be graphed by identifying a second point based on the slope. The instructor shows two methods: increasing x by one while decreasing y by two, or decreasing x by one while increasing y by two. Both approaches yield the same line, reinforcing the concept of slope and how it affects the line's direction.

Takeaways

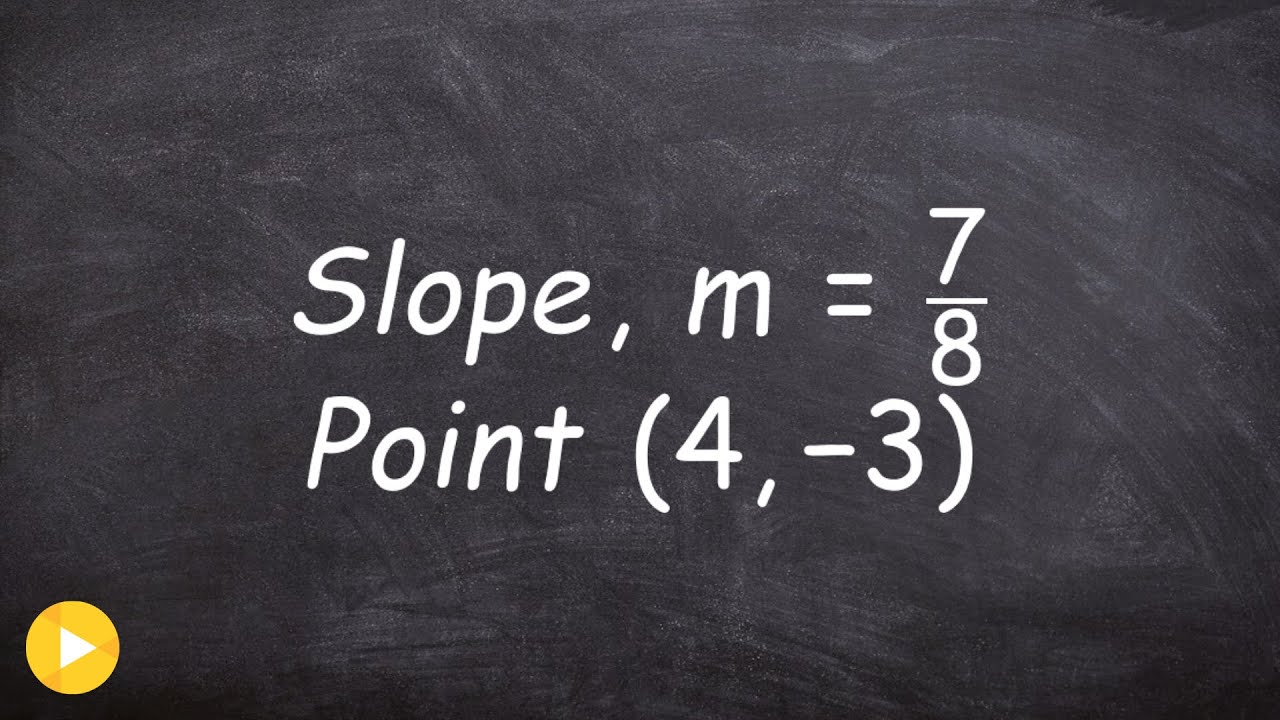
  • 📉 The task is to graph a line with a slope of negative two, containing the point (4, -3).
  • 📝 The first step is to plot the point (4, -3) on the graph by moving 4 units to the right and 3 units down from the origin.
  • 🔍 To find another point on the line, we use the slope of negative two, which means as x increases by 1, y decreases by 2.
  • 📐 Using the slope, another point can be found by moving from (4, -3) to (5, -5).
  • 📊 Graphing two points, like (4, -3) and (5, -5), is sufficient to define the entire line.
  • 🔄 An alternative method is to move in the opposite direction: if x decreases by 1, y increases by 2, due to the slope of negative two.
  • 💡 Slope is the ratio of change in y to change in x (change in y / change in x).
  • ↔️ Regardless of direction (positive or negative changes), the same line is created.
  • ✅ The key to graphing the line is understanding how to apply the slope from a known point to find another.
  • 📊 This process demonstrates two ways to find additional points for graphing using a known slope and point.

Q & A

  • What is the first step in graphing a line with a slope of -2 through the point (4, -3)?

    -The first step is to locate the point (4, -3) on the graph. This is done by moving 4 units to the right and 3 units down from the origin.

  • How does the slope of -2 affect the movement of points on the graph?

    -A slope of -2 means that for every increase of 1 in the x-direction, the y-coordinate decreases by 2.

  • What is the second point on the line if the slope is -2 and one point is (4, -3)?

    -Starting from (4, -3), if x increases by 1 to 5, y decreases by 2, giving the point (5, -5) as another point on the line.

  • Can you move in the opposite direction to plot the line? If so, how?

    -Yes, you can move in the opposite direction. If x decreases by 1, then y will increase by 2. For example, moving left from (4, -3) to (3, -1) gives another point on the line.

  • What does the slope of a line represent in terms of changes in x and y?

    -The slope represents the ratio of the change in y to the change in x. A slope of -2 means that for every 1 unit increase in x, y decreases by 2 units.

  • Why is finding a second point necessary to graph a line?

    -A line is determined by two points. Once two points are found, the line connecting them can be drawn, representing all possible points on that line.

  • What happens to y when x increases by 1 for a slope of -2?

    -When x increases by 1, y decreases by 2, following the slope of -2.

  • How would you describe a slope of -2 in terms of rise over run?

    -A slope of -2 can be described as a rise of -2 (downward) for every run of 1 (rightward).

  • What alternative method can be used to graph the line if moving right isn't possible?

    -If space doesn't allow moving right, you can move left by decreasing x by 1 and increasing y by 2, which still follows the slope of -2.

  • Is the line the same whether you increase x or decrease x when plotting points based on the slope?

    -Yes, the line remains the same whether you move to the right or left. The relationship between x and y dictated by the slope ensures the same line is graphed.

Outlines

00:00

📉 How to Graph a Line with a Given Slope and Point

The instructor demonstrates how to graph a line with a slope of -2 that passes through the point (4, -3) using a graphing tool on Khan Academy. He encourages viewers to attempt graphing on their own before following along. The process involves identifying a second point on the line by understanding the slope: as the x-value increases by 1, the y-value decreases by 2. The instructor shows how to use this information to plot the line and provides alternative approaches, such as going in the opposite direction, where a decrease in x by 1 results in an increase in y by 2. This flexibility helps when there isn't enough space to graph in the original direction.

Mindmap

Keywords

💡Graph

In the context of the video, a graph refers to a visual representation of a mathematical function, in this case, a straight line. The instructor is focused on graphing a line on a coordinate plane by using points and slope, helping viewers visualize the relationship between the variables x and y. In the script, the graph is produced after identifying two points that lie on the line.

💡Slope

Slope is a measure of how steep a line is, defined as the ratio of the change in y (vertical change) to the change in x (horizontal change). In the video, the slope is given as -2, meaning for every one unit increase in x, the y-coordinate decreases by two units. Understanding slope is key to correctly plotting the line through different points.

💡Point

A point on a graph represents a specific location on the coordinate plane, defined by an x and a y value. The instructor uses the point (4, -3) as a starting point for plotting the line. Knowing one point on the line, along with the slope, allows the viewer to calculate additional points to complete the graph.

💡Coordinate Plane

The coordinate plane is a two-dimensional surface defined by an x-axis (horizontal) and a y-axis (vertical), used to graph points and lines. In the video, the instructor plots points on this plane using the given coordinates and slope, emphasizing how these elements combine to form a straight line.

💡Change in x

The change in x refers to how much the x-coordinate increases or decreases as you move along the line. In the video, the instructor describes how increasing x by one unit helps calculate the next point on the line by following the slope. The change in x is crucial to applying the slope to find new points.

💡Change in y

Change in y refers to the difference in the y-coordinate as x changes. In the video, the slope dictates that for every one unit increase in x, y decreases by two units. This concept is essential for calculating how the line moves vertically, enabling viewers to plot the line accurately.

💡Negative Slope

A negative slope indicates that as the x-coordinate increases, the y-coordinate decreases. In the video, the slope is -2, which means the line slants downward from left to right. This negative slope plays a key role in shaping the direction of the line and understanding how to graph it.

💡Plotting Points

Plotting points involves placing points on the coordinate plane based on their x and y values. The instructor begins by plotting the point (4, -3), then uses the slope to calculate and plot additional points. This process of plotting multiple points is necessary to accurately graph the entire line.

💡Origin

The origin is the point (0, 0) on the coordinate plane where the x-axis and y-axis intersect. Although not directly used in this example, the instructor references the origin as a familiar landmark on the graph to help orient viewers when plotting other points like (4, -3). The origin is often the starting point for graphing in general.

💡Widget

In this context, a widget refers to the interactive graphing tool available on Khan Academy, which allows users to graph lines by selecting points. The instructor refers to using this widget to easily plot the points and visualize the line on a screen. This helps facilitate understanding by providing a hands-on experience with the graphing process.

Highlights

We are tasked with graphing a line that has a slope of negative two and contains the point (4, -3).

The graphing process begins by identifying the point (4, -3), which can be easily plotted by moving 4 units to the right and 3 units down from the origin.

The next step is to find a second point on the line, which can be achieved using the slope of negative two.

Slope of negative two indicates that as x increases by 1, y decreases by 2, helping to plot the next point.

Starting from the point (4, -3), when x increases to 5, y decreases from -3 to -5, giving us the point (5, -5).

Two points are sufficient to graph a line, so the line can now be drawn using these two points.

The graphing tool or widget can automatically draw the line once two points are identified.

Another approach is to consider a negative change in x, where if x decreases by 1, y increases by 2.

In this approach, if x decreases from 4 to 3, y will increase from -3 to -1, providing another point (3, -1).

The slope is defined as the change in y over the change in x, helping to understand how to plot points consistently.

Both methods—either increasing x and decreasing y, or decreasing x and increasing y—result in the same line.

Graphing the line involves understanding that slopes guide the relationship between x and y coordinates.

This method can be applied without any graphing tools, using just paper and pencil, by calculating slope and plotting points.

The process reinforces the understanding of how slope affects the direction and steepness of a line.

The key takeaway is that a negative slope means that as x increases, y decreases, and vice versa.

Transcripts

play00:00

- [Instructor] We are told graph a line

play00:01

with the slope of negative two,

play00:03

that contains the point four comma negative three.

play00:06

And we have our little Khan Academy graphing widget

play00:09

right over here, where we just have to find

play00:11

two points on that line,

play00:12

and then that will graph the line for us.

play00:15

So pause this video and even if you don't have access

play00:17

to the widget right now,

play00:18

although it's all available on Khan Academy,

play00:21

at least think about how you would approach this.

play00:23

And if you have paper and pencil handy,

play00:24

I encourage you to try to graph this line on your own,

play00:27

before I work through it with this little widget.

play00:30

All right, now let's do it together.

play00:31

So we do know that it contains

play00:33

point four comma negative three.

play00:35

So that's I guess you could say the easy part,

play00:37

we just have to find the point

play00:38

x is four y is negative three.

play00:41

So it's from the origin four to the right, three down.

play00:44

But then we have to figure out where could another point be?

play00:46

Because if we can figure out another point,

play00:47

then we would have graphed the line.

play00:49

And the clue here is that they say a slope of negative two.

play00:53

So one way to think about it is, we can start at the point

play00:56

that we know is on the line, and a slope of negative two

play00:59

tells us that as x increases by one, y goes down by two.

play01:05

The change in why would be negative two.

play01:07

And so this could be another point on that line.

play01:10

So I could graph it like this is x goes up by one,

play01:14

as x goes from four to five, y will go,

play01:17

or y will change by negative two.

play01:18

So why we'll go from negative three to negative five.

play01:21

So this will be done, we have just graphed that line.

play01:25

Now another way that you could do it,

play01:27

because sometimes you might not have space on the paper,

play01:30

or on the widget to be able to go to the right

play01:32

for x to increase, is to go the other way.

play01:35

If you have a slope of negative two,

play01:37

another way to think about it is, if x goes down by one,

play01:42

if x goes down by one, then y goes up by two.

play01:45

'Cause remember, slope is change of y over change in x.

play01:48

So you could either say you have a positive change

play01:50

in y of two when x has a negative one change,

play01:54

or you could think of it when x is a positive one change,

play01:57

y has a negative two change.

play01:58

But either way notice, you got the same line.

play02:01

Notice this line is the same thing,

play02:03

as if we did the first way is we had x going up by one

play02:06

and y going down by two,

play02:08

it's the exact same line.

Rate This

5.0 / 5 (0 votes)

Ähnliche Tags
GraphingSlopeLinear EquationsMath TutorialKhan AcademyCoordinate PlaneGeometryPlotting PointsEducationalStep-by-Step
Benötigen Sie eine Zusammenfassung auf Englisch?