ICT Mentorship Core Content - Month 1 - What To Focus On Right Now
Summary
TLDRThe speaker explains how to adopt a smart money mindset for trading, starting from a blank slate. You analyze charts to spot unfilled highs/lows, rapid price movements, and clean levels. Document daily price action, noting weekly & daily ranges on all timeframes. Separate analysis and trade execution charts. Smart money moves price to take liquidity from uninformed money. Your goal is to understand this dynamic rather than indicators or secrets. Doing proper homework sets the foundation to see repeating patterns showing institutional order flow over time.
Takeaways
- 😀 The script discusses trading mindsets and perspectives to adopt for success
- 😯 There are two main perspectives - the smart/informed money and the uninformed/speculative money
- 🤔 The uninformed money believes indicators drive price action while the smart money controls and manipulates price
- 😮 As traders, we need to adopt the smart money perspective to profit
- 📝 We should start by logging daily price action and key levels on multiple timeframes
- 🔍 Note areas where price moves quickly or leaves equal highs/lows which act as future liquidity
- 🗓 Track the daily and weekly highs/lows and what days/sessions they form in
- 📈 Don't forecast yet - observe and document price action and market mechanics
- 😊 Suppress the desire for trading techniques initially and focus on market foundations
- 📚 Build your knowledge and experience through practice, exposure and guidance
Q & A
What is the overall theme and goal of the video series?
-The overall theme is understanding the mindset and perspective traders need to have when analyzing the markets, specifically adopting a "smart money" point of view rather than a retail trader perspective.
What is the difference between smart money and uninformed/speculative money?
-Smart money refers to institutional traders, banks, and other major market players who have more information and control over price. Uninformed/speculative money refers to retail traders who lack the same level of knowledge and tend to rely more on indicators.
What perspective should traders adopt according to the speaker?
-Traders should adopt the perspective of a liquidity provider or smart money, viewing everyone else as a source of liquidity and recognizing that price is delivered to benefit smart money interests.
What are the four primary drivers of price delivery discussed?
-The four primary drivers are retracement, expansion, reversal, and consolidation.
What daily practice does the speaker recommend for new students?
-The speaker recommends creating a daily price action log with multiple time frame charts, noting recent unfilled highs/lows, areas of quick price movement, and daily highs/lows.
Why does the speaker recommend using a single currency pair at first?
-To allow students to develop their own understanding rather than just mirroring the analysis on the pairs used in the course.
What should new students resist the urge to do?
-New students should resist the urge to try to forecast future price movements, as that will lead to frustration.
Why does the speaker create separate analysis and execution charts?
-To avoid having overly cluttered charts and to allow flexibility to update analysis without impacting live trading decisions.
What do the daily/weekly highs and lows represent?
-They represent areas where liquidity is resting that the price may move towards, either stopping out positions or triggering pending orders.
How will the practices taught in this video help traders?
-They will build market understanding over time by logging and analyzing repeating price behavior, aligned with smart money concepts.
Outlines

هذا القسم متوفر فقط للمشتركين. يرجى الترقية للوصول إلى هذه الميزة.
قم بالترقية الآنMindmap

هذا القسم متوفر فقط للمشتركين. يرجى الترقية للوصول إلى هذه الميزة.
قم بالترقية الآنKeywords

هذا القسم متوفر فقط للمشتركين. يرجى الترقية للوصول إلى هذه الميزة.
قم بالترقية الآنHighlights

هذا القسم متوفر فقط للمشتركين. يرجى الترقية للوصول إلى هذه الميزة.
قم بالترقية الآنTranscripts

هذا القسم متوفر فقط للمشتركين. يرجى الترقية للوصول إلى هذه الميزة.
قم بالترقية الآنتصفح المزيد من مقاطع الفيديو ذات الصلة

Steven Pinker: Human nature and the blank slate
How I would Learn Trading FAST As A Beginner (if i had to start over)

"If You Want to Get Rich, Stop Thinking Like a Poor Person"
I stopped chasing money & it flowed into my life like water

Identifying Key Structures & Liquidity Zones
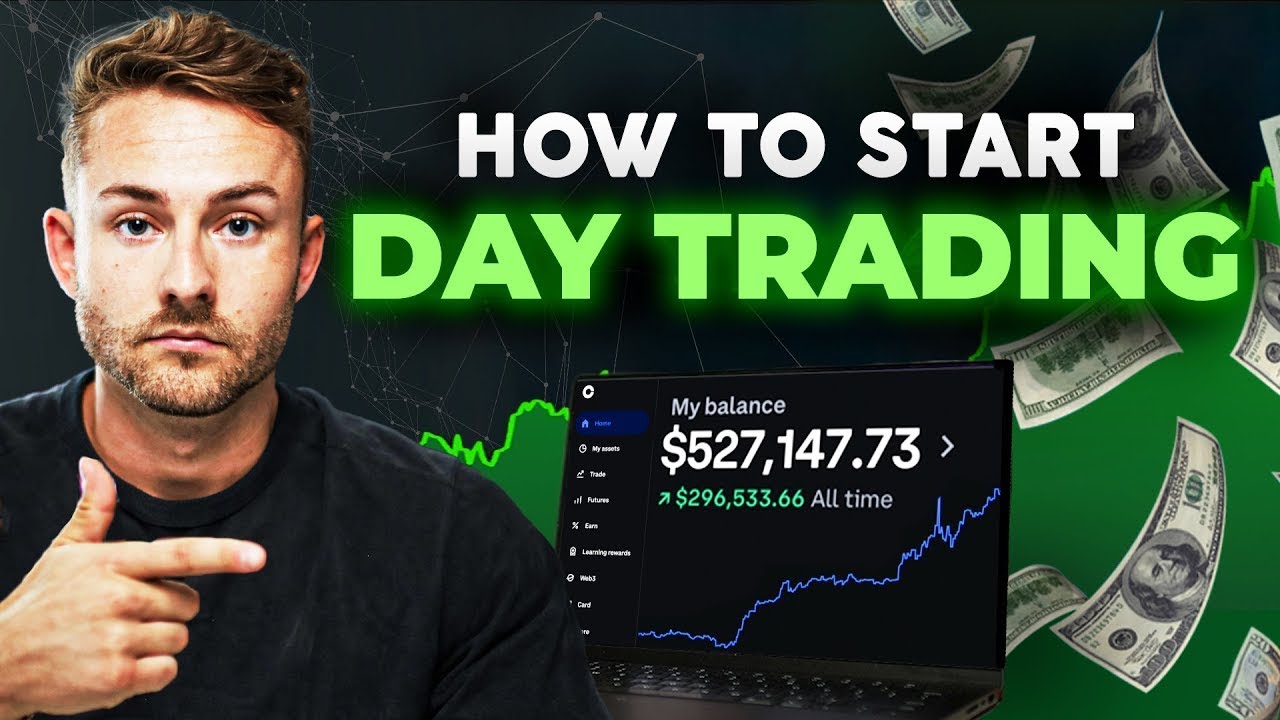
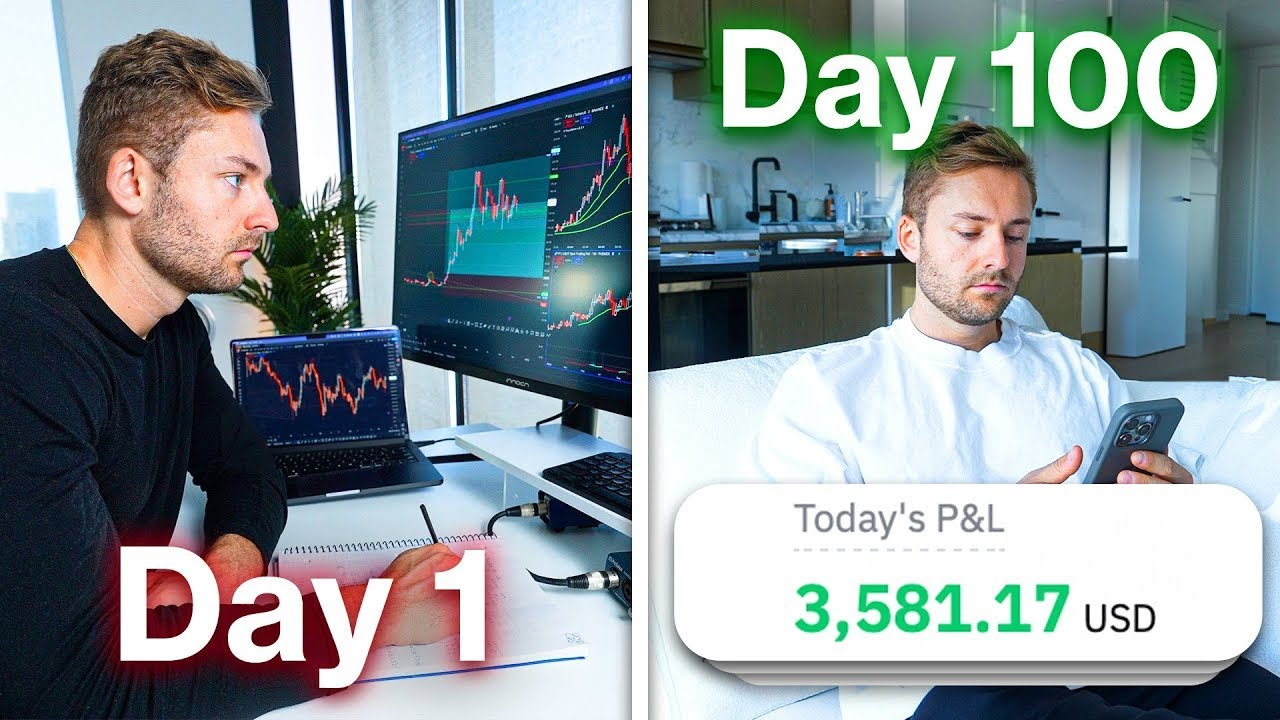
How to Start Day Trading As A Beginner [2024 Full Guide]
5.0 / 5 (0 votes)
