SPSS tutorial in tamil for beginners part -1 | Introduction
Summary
TLDRThis video introduces SPSS (Statistical Package for the Social Sciences) and its applications in data analysis. It covers key aspects such as the data editor, output windows, and the essential functions of SPSS, including descriptive statistics, examining relationships between variables, and comparing groups using tests like T-tests and ANOVA. The tutorial aims to provide a foundational understanding of SPSS, guiding viewers through its basic operations and explaining how to use the software for effective data analysis.
Takeaways
- 📊 SPSS is a powerful tool used for statistical analysis in research.
- 🔧 The video covers step-by-step instructions on using SPSS effectively.
- 📂 SPSS has two main windows: the Data Editor and the Output window.
- 📝 The video explains the importance of understanding the basics before diving into SPSS, such as knowing what it is and its purpose.
- 📈 SPSS allows for three basic types of data analysis: descriptive statistics, examining relationships between variables, and comparing groups.
- 🔍 Descriptive statistics in SPSS include measures like mean, minimum, maximum, and standard deviation.
- 📉 The video discusses how SPSS can be used for correlation and regression analysis to examine relationships between variables.
- ⚖️ SPSS is also used to compare groups using tests like T-tests, ANOVA, and nonparametric statistics.
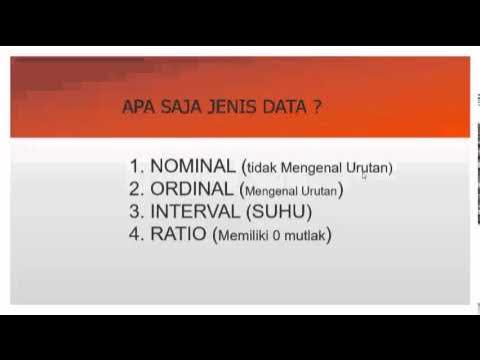
- 📚 Understanding variables is crucial in SPSS, especially when comparing different groups or analyzing data trends.
- 🎓 The video concludes by emphasizing the importance of familiarity with SPSS tools and functions to efficiently analyze data.
Q & A
What is the main focus of the video script?
-The main focus of the video script is to introduce and explain the basics of SPSS, including its uses, features, and how to perform data analysis using descriptive statistics, correlation, and other statistical methods.
What does SPSS stand for, and what is its purpose?
-SPSS stands for Statistical Package for the Social Sciences. Its purpose is to analyze data by applying various statistical techniques, such as descriptive statistics, correlation, regression, and more.
What are the three main things to learn before starting with SPSS?
-The three main things to learn before starting with SPSS are: understanding what SPSS is and its purpose, familiarizing yourself with the two main windows (Data Editor and Output), and understanding the basics of case selection and organization within SPSS.
How does SPSS help in analyzing data?
-SPSS helps in analyzing data by enabling users to describe data using descriptive statistics, examine relationships between variables through correlation and regression analysis, and compare groups to determine significant differences using techniques like T-tests and ANOVA.
What are descriptive statistics in SPSS, and why are they important?
-Descriptive statistics in SPSS include measures such as mean, minimum, maximum, and standard deviation. They are important because they provide a summary of the data, helping to understand its central tendency, dispersion, and overall distribution.
What is correlation analysis in SPSS?
-Correlation analysis in SPSS is a method used to examine the relationship between two or more variables to determine if they move together, typically represented by the correlation coefficient (e.g., Pearson's r).
How does SPSS handle the comparison of groups?
-SPSS handles the comparison of groups by using techniques such as T-tests, analysis of variance (ANOVA), and non-parametric statistics to determine if there are significant differences between the groups.
What is the significance of understanding variable types in SPSS?
-Understanding variable types in SPSS is significant because different statistical methods require different types of variables. For example, categorical variables are analyzed differently than continuous variables, and the choice of statistical test depends on the variable types.
What are some common statistical methods mentioned in the script that SPSS can perform?
-Common statistical methods mentioned in the script that SPSS can perform include descriptive statistics, correlation analysis, regression analysis, factor analysis, T-tests, ANOVA, and non-parametric tests.
Why is it important to have a blueprint or curriculum when learning SPSS?
-Having a blueprint or curriculum is important when learning SPSS because it provides a structured approach to mastering the software, ensuring that learners understand the key concepts, tools, and methods needed to analyze data effectively.
Outlines

هذا القسم متوفر فقط للمشتركين. يرجى الترقية للوصول إلى هذه الميزة.
قم بالترقية الآنMindmap

هذا القسم متوفر فقط للمشتركين. يرجى الترقية للوصول إلى هذه الميزة.
قم بالترقية الآنKeywords

هذا القسم متوفر فقط للمشتركين. يرجى الترقية للوصول إلى هذه الميزة.
قم بالترقية الآنHighlights

هذا القسم متوفر فقط للمشتركين. يرجى الترقية للوصول إلى هذه الميزة.
قم بالترقية الآنTranscripts

هذا القسم متوفر فقط للمشتركين. يرجى الترقية للوصول إلى هذه الميزة.
قم بالترقية الآن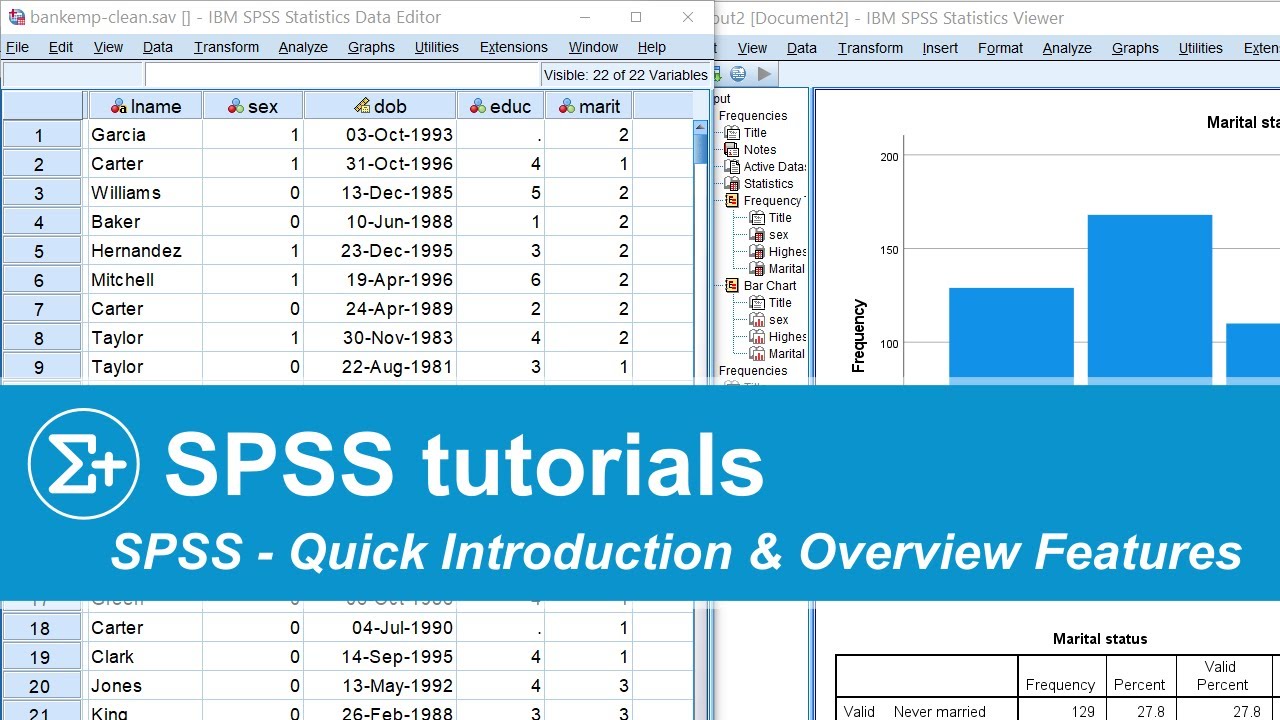


5.0 / 5 (0 votes)
