AWS re:Invent 2020: Detect machine learning (ML) model drift in production
Summary
TLDRThis AWS re:Invent session, led by Principal Solutions Architect Sireesha Muppala, delves into detecting machine learning model drift in production using Amazon SageMaker. The session covers the importance of model monitoring, introduces SageMaker's Model Monitoring capability, and outlines the end-to-end deployment and monitoring process. It discusses strategies for addressing model drift, including retraining, and provides a functional notebook demonstrating the code and APIs behind SageMaker's monitoring steps, ensuring models remain accurate and reliable over time.
Takeaways
- 🌟 Amazon SageMaker is a fully managed service that streamlines the machine learning process, including data collection, model training, deployment, and monitoring.
- 🔍 Model Monitoring in SageMaker is crucial for detecting model drift in production, ensuring models remain accurate and reliable over time.
- 🛠️ SageMaker's Model Monitor capability automates the monitoring of machine learning models in production, detecting errors and triggering corrective actions.
- 📈 Model drift, both in data and performance, can significantly impact prediction quality, making continuous monitoring essential for maintaining model accuracy.
- 🔄 SageMaker allows for the setting up of alarms in Amazon CloudWatch based on model monitoring metrics, enabling proactive management of model performance.
- 📊 Data drift and accuracy drift metrics are persisted in S3 buckets and can be visualized in SageMaker Studio, providing insights into model behavior.
- 🚀 The end-to-end flow for deploying and monitoring models in production includes deploying the trained model, capturing inference requests, baselining, and reacting to drift detection.
- 📚 The demo in the session showcased how to use SageMaker to host trained models, capture inference data, generate baseline statistics, and monitor for data quality drift.
- 🔧 SageMaker processing jobs can be used to automate the analysis of captured inference data against baseline constraints, identifying data drift violations.
- 💡 CloudWatch alerts can be configured based on threshold values for drift metrics, triggering actions such as retraining when model performance degrades.
- 👨🏫 The session emphasized the importance of understanding and managing model drift to ensure business outcomes are not negatively impacted by outdated or degraded models.
Q & A
What is the main focus of the re:Invent session presented by Sireesha Muppala?
-The session focuses on detecting machine learning model drift in production using Amazon SageMaker, discussing the importance of monitoring models, introducing model monitoring capabilities, and demonstrating an end-to-end model deployment and monitoring flow.
What is Amazon SageMaker and what does it offer?
-Amazon SageMaker is a fully managed service that simplifies each step of the machine learning process by providing decoupled modules for data collection, model training and tuning, model deployment, and model monitoring in production.
Why is it important to monitor machine learning models in production?
-Monitoring is crucial because real-world data may differ from training data, leading to model drift or data drift over time. This can degrade model performance and impact business outcomes, making continuous monitoring essential for identifying when to retrain models.
What is model drift and how can it affect model performance?
-Model drift refers to the gradual misalignment of a model with real-world data as it ages, due to changes in data distributions. This can significantly impact prediction quality and model accuracy, necessitating proactive monitoring and corrective actions.
How does Amazon SageMaker's Model Monitoring capability help in detecting model drift?
-Amazon SageMaker's Model Monitoring capability uses Model Monitor to continuously monitor machine learning models, detect errors, and trigger alerts for remedial actions. It analyzes data based on built-in or customer-provided rules to determine rule violations and emits metrics into Amazon CloudWatch for further action.
What are the steps involved in the end-to-end model deployment and monitoring flow?
-The flow starts with deploying the trained model, enabling data capture, capturing real-time inference requests and responses, generating baseline statistics and constraints, creating a data drift monitoring job, and taking corrective actions once drift is detected.
How does SageMaker handle data capture for model monitoring?
-When deploying a SageMaker endpoint, data capture can be enabled to capture request and response data in a specified S3 location. This captured data is used for comparing against baseline data to identify data drift.
What is the purpose of generating baseline statistics and constraints in model monitoring?
-Baseline statistics and constraints are used to establish a reference point for monitoring. They include metadata analysis and thresholds for monitoring purposes, helping to detect deviations in real-world data compared to the training data.
How can businesses react to model drift detection?
-Once model drift is detected, businesses can take corrective actions such as retraining the model, updating training data, or updating the model itself. They can also set up CloudWatch alarms to trigger these actions when certain thresholds are violated.
What is the role of SageMaker Studio in visualizing model monitoring results?
-SageMaker Studio can visualize data drift and accuracy drift metrics that are persisted in S3 buckets. It allows users to chart metrics against baselines for better analysis and understanding of model performance over time.
Can you provide an example of how to use SageMaker Model Monitor in a real-world scenario?
-In the demo, a Jupyter notebook is used to demonstrate hosting trained machine learning models on Amazon SageMaker, capturing inference requests and results, analyzing a training dataset to generate baseline statistics and constraints, and monitoring a live endpoint for violations against these baseline constraints.
Outlines
🤖 Introduction to Machine Learning Model Drift
Sireesha Muppala, a Principal Solutions Architect at AWS, introduces the session on detecting machine learning model drift in production. She explains the importance of monitoring ML models and provides an overview of Amazon SageMaker, a fully managed service that streamlines the machine learning process. The session will cover model deployment, monitoring, and corrective actions upon detecting model drift. SageMaker's Model Monitoring capability is highlighted for its ability to detect errors and trigger remedial actions without the need for custom tooling.
🔍 End-to-End Model Deployment and Monitoring
This paragraph outlines the architecture and steps involved in deploying and monitoring machine learning models in production using Amazon SageMaker. It starts with deploying the trained model and enabling data capture, followed by capturing real-time inference requests and responses. Baseline data is established using a baselining job that generates statistics and constraints from training data. A data drift monitoring job is then executed periodically to compare inference requests against the baseline, generating reports and metrics that can trigger alarms and corrective actions.
📊 Detecting Data and Model Quality Drift
The paragraph discusses the process of detecting data quality drift and model accuracy drift. It explains how to use SageMaker Model Monitor to detect accuracy drift by comparing predictions with ground truth data. The process involves capturing predictions, providing ground truth inference, and executing a merge job to combine these datasets. Model quality monitoring jobs generate statistics, violations, and Cloud Watch metrics, which can be visualized in SageMaker Studio. The paragraph also covers how to take actions based on these metrics, such as retraining the model.
🎬 Demonstrating Model Monitoring in Action
In this paragraph, a demo is presented using a Jupyter notebook to demonstrate hosting trained machine learning models on Amazon SageMaker, capturing inference requests and results, and using SageMaker Model Monitor to analyze training data sets. The demo covers generating baseline statistics and constraints, monitoring a live endpoint for violations against baseline constraints, and identifying data quality drift. The use case involves an XGBoost-based movie recommendation model, and the process is shown through various API calls and execution results.
📚 Analyzing Captured Data and Setting Up Monitoring
This paragraph details the steps taken in the demo to analyze captured data and set up continuous monitoring. It includes examining the captured data for baseline violations, automating the analysis process using SageMaker processing jobs, and generating statistics and constraints files. The constraints file suggests threshold values for detecting data drift. The paragraph also covers configuring continuous monitoring and analyzing the results to detect data drift.
🚀 Reacting to Drift Detection and Model Retraining
The final paragraph of the script covers the steps taken in the demo to react to drift detection and trigger model retraining. It includes creating an 'sns' topic and a Cloud Watch alarm to monitor for drift violations. If a violation is detected, an alarm is triggered, and a message is published to the 'sns' notification topic, which in turn triggers a Lambda function to retrain the model. The demo concludes with instructions to delete resources to avoid unnecessary costs and a reminder to complete the session survey.
Mindmap
Keywords
💡Model Drift
💡Amazon SageMaker
💡Model Monitoring
💡Data Capture
💡Data Distribution
💡Machine Learning Model
💡Retraining
💡CloudWatch Metrics
💡Baseline
💡Drift Detection
💡SageMaker Studio
💡Jupyter Notebook
Highlights
Amazon SageMaker is a fully managed service that simplifies the machine learning process.
Monitoring machine learning models in production is crucial due to potential model drift.
Amazon SageMaker's Model Monitoring capability helps detect model drift without building custom tooling.
Model drift can be caused by changes in real-world data distributions over time.
Continuous monitoring allows for timely retraining of ML models to maintain prediction quality.
Amazon SageMaker provides real-time inference endpoints for deployed models.
Data capture is enabled in SageMaker endpoints to collect inference requests and responses.
Baseline data is essential for comparing against real-time inference data to detect data drift.
SageMaker generates statistics and constraints from training data for monitoring purposes.
Data drift monitoring jobs compare inference requests against baseline stats and constraints.
Violations of monitoring rules trigger metrics emission into Amazon CloudWatch for alerting.
Model quality can be monitored by comparing predictions with ground truth data.
SageMaker Model Monitor supports out-of-the-box metrics for classification and regression.
CloudWatch alerts can be set up based on threshold values for detected drift metrics.
Detected model drift can trigger actions such as retraining the model.
The end-to-end flow for deploying and monitoring ML models in production includes reacting to model drift detection.
A demo in the session shows how to host trained models on SageMaker, capture inference requests, and monitor for violations.
The movie recommendation model demo uses the movie lens dataset and focuses on the 'age' feature for data drift analysis.
SageMaker processing jobs automate the analysis of data capture files for detecting baseline violations.
Continuous monitoring can be configured using SageMaker's monitoring schedules.
CloudWatch alarms and SNS topics can be used to trigger actions like model retraining when drift is detected.
The demo concludes with a walkthrough of the process for data quality drift detection and retraining.
Transcripts
Thank you for viewing the re:Invent session on detecting
machine learning model drift in production.
My name is Sireesha Muppala
and I'm a Principal Solutions Architect at AWS.
I work with multiple customers across various business
verticals on their AI/ML workloads.
Today we'll start our session with a quick introduction
of Amazon SageMaker and a shorter discussion
on why it is important to monitor
machine learning models in production.
Then I'll briefly introduce Model Monitoring capability
of Amazon SageMaker, then we'll look into
the end-to-end Model Deployment and Monitoring Flow.
We'll follow that up with a few options
that you as a customer can take once a model drift has been detected.
Finally, we'll wrap it up with a functional notebook
that will take a look at the code and the APIs
behind these various steps.
Amazon SageMaker is a fully managed service that removes
the heavy lifting from each step of machine learning process
through decouple modules for collecting and preparing data,
training and tuning a model, deploying the trained model,
and finally, monitoring the models deployed into production.
With deploying module, SageMaker provides the ability to host
real-time inference endpoints.
In this session we'll focus on monitoring
the production model endpoints.
Machine learning models are typically trained
and evaluated using historical data.
But the real-world data may not look like the training data,
especially as the models age over time
and the data distributions change.
For example, the inputed data units may change from Fahrenheit to Celsius
or maybe, all of a sudden, your application is sending
null values at your model,
which impacts the model quality quite a bit.
Or maybe, in a real-time retail world consumer scenario,
the consumer purchases preferences change over time.
This gradual misalignment of the model in the real world
is known as model drift or data drift and it can have
a big impact on prediction quality.
Similarly, the model performance may degrade over time as well.
Degraded model accuracy over time impacts business outcomes.
To proactively address this problem, it is crucial to continuously monitor
the model performance.
This continuous monitoring allows you to identify the right time
and the frequency to retrain your ML model.
While retraining too frequently can be too expensive,
not training often enough could result
in less-than-optimal predictions from your machine learning model.
Amazon SageMaker model monitoring capability
addresses this exact need.
Using Model Monitor, machine learning models are monitored
and errors are detected so that you as a customer
can take remedial actions.
The model monitoring capability eliminates the need to build
any kind of tooling to monitor models in production and detect
when corrective actions need to be taken.
The model monitoring capability analyses the data collected
based on built-in rules or customer provided rules
at regular frequency to determine if there are any rule violations.
The built-in statistical rules can be used to analyze tabular data
and detect common issues such as outliers in prediction data.
Drift and data distributions can also be detected and so can the changes
in prediction accuracy based on observations
from the real world.
With model monitoring, when these rules are violated,
metrics are emitted into Amazon Cloud Watch
so that you can set up alarms to audit and retrain models.
Data drift and accuracy drift metrics are also persisted
into S3 buckets and can be visualized in SageMaker Studio.
Using all of these capabilities together, an end-to-end flow
for deploying and monitoring models in production looks like this.
It starts with deploying the trained model
and ends with taking a corrective action once drift is detected.
Now, to go along with that end-to-end flow,
here's the end-to-end architecture.
There are quite a few different components here,
so let's get to billing this out step-by-step.
The very first step here is to deploy the trained model.
We start with ground truth training data
and run a training job on SageMaker, which generates a model artifact.
A deployed SageMaker endpoint makes the trained model available
for model consumers.
Now, when you create that endpoint, make sure you enable data capture.
Now, with this endpoint deployed, a consuming application
can now start sending requests and give back predictions
from your model.
Since data capture was enabled in our previous step, the request
and the responses are captured in the S3 location of your choice.
Now that the real-time inference request and the responses
are being captured, to identify if there's
any kind of data drift, we need to have some baseline data.
In the next step, we execute that baselining job that generates
the statistics and constraints about the training data.
The statistics generated include metadata analysis
of the training data.
That means metrics are just some mean maximum value, minimum value
for duplicate features and metrics like this then counts
for string features.
On the other hand, the constraints generated captures
a threshold for these stats for monitoring purposes.
So, the constraints can also include conditions along the lines of:
a particular feature should always be considered as a string,
not as an integer or, a particular specific field
should be a not null field.
You can review these constraints generated
and choose to modify or even alright them based on
your business domain knowledge.
So, now that we have both the baseline details
and we have captured the inference request,
so we can compare the two to identify any kind of drift.
In this step you'll create a data drift monitoring job
that SageMaker will periodically run on your behalf at the schedule
that you select.
The job compares the inference requests
against the baseline's stats and constraints.
For each execution of the monitoring job,
the generator results include a violation report,
that is persisted once again in Amazon S3,
a statistics report of the data that is collected during the run
and also summary metrics
and stats that are emitted to Amazon Cloud Watch.
Out of the box, here are the few violations
that are generated.
So, we have data type check as the first one.
So, this violation is generated if the data types
of a particular feature in inference request doesn't match
the baseline constraint.
Similarly, we have violations for completeness check,
missing column check, extra columns check,
and categorical values check as well.
Ok, so, at this point we're able to detect data quality drift.
But what happens if the quality of the model itself changes?
Say for example, the accuracy of the model decreases.
Now, let's see how to use the Model Monitor capability
to detect the accuracy drift.
At the core, the process for detecting accuracy drift
will look very similar to the one that we just went through
for data drift.
We collect the predictions made and the ground truth
of the prediction and compare the two.
First, by merging.
Now, we already have the predictions captured
because we enabled data capture for our endpoint.
You next need to provide ground truth inference
that the model consuming application should be providing.
So, what does this mean?
What does a prediction ground truth mean?
That would actually depend on what your model is predicting
and what the business use case is.
Let's say for example you are monitoring
a movie recommendation model.
A possible ground truth inference in this case is whether the user
has actually watched the recommended movie or not.
Or maybe they just clicked on the video but they didn't actually
complete watching it.
So, there should be some application logic
that needs to provide this ground truth inference.
With both the predictions captured and ground truth provided
by your model consuming application, SageMaker executes a merge job
to merge these two data sets together.
The merge job once again is a periodic job that is executed
on your behalf.
Once you have the data merged, it's time to monitor the accuracy.
In this step, you create a model monitoring quality job.
Excuse me, it should actually be model quality monitoring job.
A job that is executed periodically at a schedule that you provide
on your behalf by SageMaker.
Once again, the model quality job also generates statistics, violations
and Cloud Watch metrics.
The metrics that are generated by the two monitoring jobs
can actually be visualized in SageMaker Studio as well.
For the model quality monitoring job,
here are some of the metrics that are generated.
These include accuracy, affluent values, precision,
and recall.
SageMaker Model Monitor supports classification and regression metrics
out of the box, but you can bring your own metrics as well.
You can also choose to chart a particular metric
against the baseline for visualization purposes.
Ok, so now, at this point, we're able to detect
both data quality drift and model quality drift.
Now it's time to take actions on that.
Both the data drift and the model quality monitoring jobs
emit Cloud Watch metrics, as I mentioned before.
The data drift monitoring job emits Cloud Watch metrics
such as maximum-minimum average values for numerical features
along with completeness and drift metrics for both numerical
and string features.
You can create Cloud Watch alerts for these metrics
based on threshold values and, if those thresholds are violated,
Cloud Watch alerts will be raised.
Once that an alert is generated, you can decide on what actions
you want to take on these alerts.
Maybe one of the possible actions would be to retrigger training.
Similarly, model quality monitoring job also
generates Cloud Watch metrics.
So, here you can see accuracy, affluent, recall and you'll see stats
of maximum values, minimum values, count and average
for these various metrics.
So, once we have those metrics, you can take actions like updating
the model, updating your training data, and retraining
and updating the model itself.
Now, if you choose to retrain the model, now you're completing
that loop, so you go back all the way to the ground truth training data
and start training your model one more time.
This is the end-to-end flow for deploying the monitored ML models
in production.
We started with deploying the trained model
and ended with reacting to the model drift detection.
While this flow showcased both data drift and accuracy drift,
you can actually choose to do one or the other.
For example, after deploying the model in production,
you can choose to monitor the accuracy drift
and completely act on it.
Similarly, after deploying the model in production,
you can monitor and detect, and act on data drift completely
bypassing the accuracy drift.
In fact, this is exactly what we're going to see in our demo next,
with the help of a particular use case.
So, let's jump in to the demo.
In this demo, I'll walk through a Jupyter notebook that demonstrates
how to host trained machine learning models
on Amazon SageMaker and capture inference requests and results,
how to use SageMaker Model Monitor to analyze a training data set
to generate baseline statistics and constraints
about the training data.
And finally, how to use SageMaker model monitoring capability
to monitor a live endpoint for violations
against the baseline constraints, to identify the data quality drift
and react to it.
In the interest of time, the notebook has already been executed.
We'll exam the various API calls used and the results of the execution.
The use case used in this demo is an XGBoost based
movie recommendation model.
In Section 1, we deal with a few steps
to set everything up.
We'll import all the necessary libraries,
specify the AWS related region and role variables,
as well as define several other variables
that we're gonna use throughout the notebook here.
And once we have the setup activities out of the way,
let's start looking at the training data itself.
The movie recommendation model was trained using the movie lens data
that is available at this link.
In this data set, the target variable is the rating of the movie
provided by the user and the features include user ID,
item ID, movie genre, age, zip code of the user, user gender,
and finally, one hard encoded representation
of the user occupation.
Throughout the notebook, we'll use the feature age,
which is a numerical field, to discuss baseline violations
and data drift.
The same concept will apply to other features of the data set as well.
In Section 2, we'll upload the pre-trained model
to the S3 bucket and then we'll create
a SageMaker model entity using SageMaker's create model API.
At this point, we have a model entity in hand and we need
to host that on an endpoint.
So, to do that, we'll first specify the data capture configuration,
where you specify this EnableCapture to True
and you specify whether you want to capture both the input data
and output data, or just one of those,
and where you want to process the data captured
in your S3 locations.
So, right here, using this destination S3 URL path
you specified and you'll have complete control
over that S3 location, which means that this will allow you
to version this data and secure it with IM policies
and encryption according to your needs.
Once you have the data capture configuration set up,
you pass that into the endpoint configuration API
from SageMaker along with the compute instance type
and the compute instance count that is necessary to host the model.
So, at the end of this step, you'll have
an endpoint configuration ready
and, using that endpoint configuration in the next step here,
you actually create an endpoint using
the create_endpoint API.
So, this is basically hosting the model on the compute instance
that you have specified with data capture enabled.
As you can see, this takes a few minutes to complete.
In my experimentation it took about 7 minutes for that to complete.
At the end of the 7 minutes, what you have
is a real-time inference endpoint that is ready to take
inference requests.
So, in Section 3 we're going to hit that endpoint with data
and start capturing the input data, as well as the results.
To invoke the endpoint, as you can expect,
we'll use the SageMaker's endpoint: invoke_endpoint API,
to which you point in the endpoint's name.
Now, using that approach, here we have recommendations
for a couple of users that we got back
from the deployed endpoint.
Now, since the endpoint already has the data capture enabled
and we started sending requests to the endpoint,
we should start seeing the data capture files in the S3 location.
So, when you list out the objects in the S3 location
that you previously specified, you'll start seeing this .json files
which have that data capture.
So, once we have the list, let's actually go look
at one of the single file that has been captured.
So that's what we're doing in this cell where we are just
printing out the S3 object body.
So, here you can see that all the data that is captured
is in .json line formatted file and for each inference request made
against the real-time endpoint, a single line is captured.
If you dive into the content of the single .json line,
you'll see that we're capturing the endpoint input,
the endpoint output, as well as event metadata.
And let's go dive a little bit into the data input
that is captured in this file.
So, here you can see that this is the data that is coming
at your endpoint and if you observe one of the features
which is age, for our specific purposes,
you'll see that the inference traffic sent
has age as a float value, 37.0 to be exact.
But when we initially examined the training data,
this feature was an integer.
So, while the deployed model provided prediction
even with this kind of inconsistency, it is good to understand
how your inference traffic is deviating
from the training baseline.
But it is tedious and error prone to perform this kind of analysis
manually on each line of the data capture file.
So, in Section 4 we're going to automate this process
using SageMaker processing job.
Before we kick-off the processing job,
we're going to specify where exactly our baseline data is
and where we want our results of the processing job analysis
should go in to.
So, we specify those values and then we kick-off
the processing job in this particular cell here.
As you can see, this is also another job that takes a few minutes
to complete and, in my particular case here,
it took about 6 minutes.
And at the end of which, I have two different files:
constraints.json and statistics.json.
So, let's explore what's in the generated statistics file here.
In this file, for numerical features like rating, item ID, and user ID,
the processing job calculates stats like sum, mean, standard deviation,
minimum and maximum values, along with identifying
any kind of missing values.
Similarly, for numerical type of features
like zip code,
we'll see a similar thing, but in addition,
we'll see the distinct count for that particular feature.
Alright, that's about stats.
Now, additional to the stats we also had a constraints file
in our results folder.
So, let's go look at what's in this constraints.json.
So here you can see that, for [INDISCERNIBLE] features
like user ID, item ID, movie genre, your particular feature cannot be
non-negative, right?
And also, you'll see that features like zip code, right here,
it needs to be a string value, not a numerical value.
And if you actually print out the contents of the constraints file,
like I'm doing in this cell here, towards the end
of this constraints file, you'll have this monitoring config section
that defines the threshold values for various constraints.
And if these threshold values are violated,
that means we're observing data drift.
So that's what the threshold values are used for, to detect drift.
Now, this constraint file generated is just a suggestion
by SageMaker processing job, you can choose to overwrite it,
either at the field level or the file level,
based on your business domain knowledge.
In Section 5 we're going to take this a little bit forward
and then configure a continuous monitoring
and analyze the results to actually do the data drift.
So, we start by creating the monitoring schedule right here.
And once that is scheduled, we'll start generating
some inference traffic just in an infinite loop here,
we're continuously hitting that endpoint.
And we'll use the different APIs like describe_monitoring_schedule,
list_monitoring_executions, to look at the status of various executions
of this monitoring schedule.
And this monitoring schedule is going to be executed periodically,
based on the period that you provided when you configured it.
Ok, so let's look at the very first execution
of the job here.
So, here.
So, when you look at the status of the very first execution,
you can see that the job has been completed but it has been completed
with violations.
So, we can use the response from the list monitoring
execution API calls to find the exact location
of that violations report.
So, here you can see that the report you alright is
right here, so that means that violations report is actually
stored in your S3 bucket as well.
So, here's another view of constraint_violations.json.
Now, if you look at actually what is in the constraints file,
you'll see several different violations here.
And I'm gonna focus on what's happening
with the feature age' here.
So, for feature 'age', I got a data type check, which, once again,
means that the 'age' feature was expecting a numerical value,
an integral value, but it got float value.
So, we got a violation at about 100% here.
Now we're able to detect any kind of violations
against our baseline data.
In Section 6, we're going to take it one step forward
and use that to detect drift and retrigger training.
In Section 6, we'll first create an 'sns' topic
and a Cloud Watch alarm.
For our Cloud Watch alarm, we use the SageMaker's specific name spaces
and SageMaker's specific dimensions here.
And you'll see that we also set a threshold for our drift value here,
which means that, if there's a violation
or drift notice for 'age' feature, then the alarm is triggered,
indicating that there's a drift.
So, when you execute this code, you should see a Cloud Watch alarm
generated in your console right here.
In the initial stages it will be an insufficient data stage
and, in a few minutes, it will change into the alert stage
or the alarm stage.
When that alert is triggered, a message gets published
in the 'sns' notification topic which triggers a Lambda function,
which will actually retrigger the retraining of the model.
So, in the SageMaker console, you should see a new training job
kicked-off and either this will be in progress or completed,
depending on when you check on the status of the job.
So, that brings us to the end of the data quality
drift detection demo.
If you're experimenting with this notebook
in your AWS account, we recommend that you delete all the resources
using SageMaker APIs that are mentioned
in this optional section right here, so that you can avoid
any unnecessary cost.
The code for the demo you saw is available in the GitHub
at this particular location.
While the notebook just showed you how to monitor for data drift,
you can easily extend it to include accuracy monitoring as well,
using the appropriate SageMaker APIs.
That brings us to the end of this session.
Thank you for taking the time to watch this session
and please remember to complete the session survey
and leave us your feedback.
Thank you.
تصفح المزيد من مقاطع الفيديو ذات الصلة
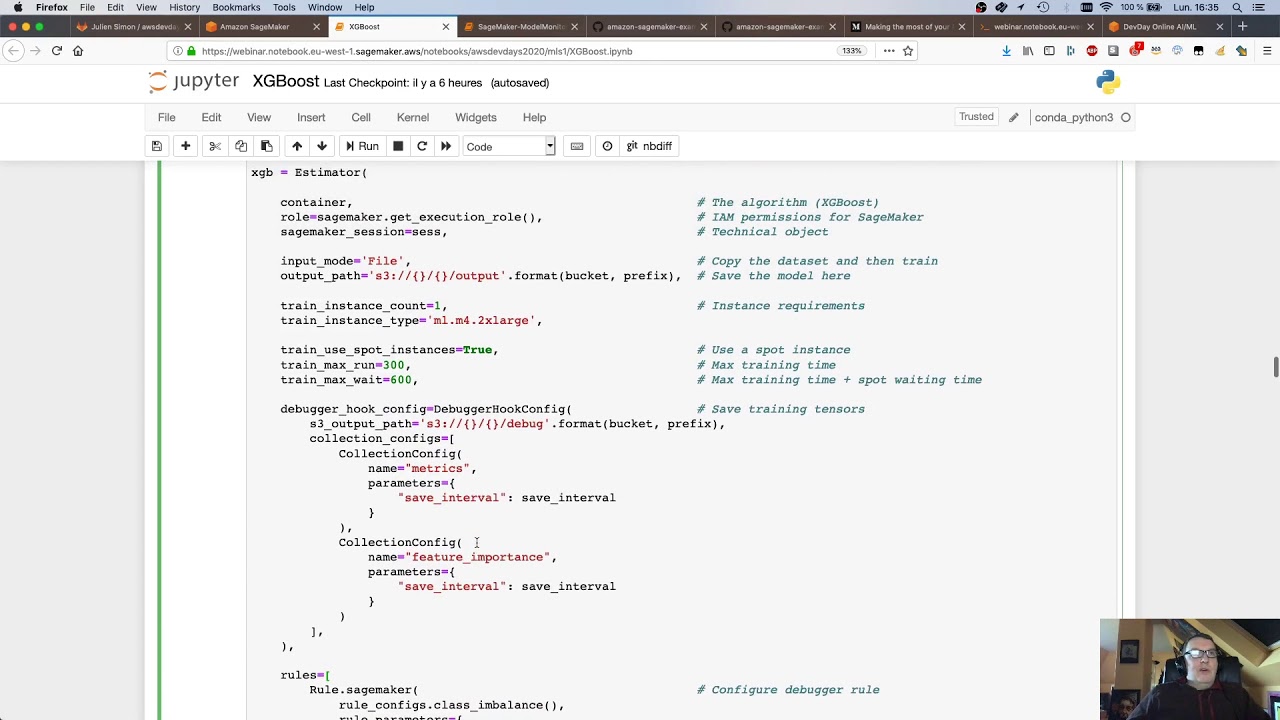
AWS DevDays 2020 - Deep Dive on Amazon SageMaker Debugger & Amazon SageMaker Model Monitor
Model Monitoring with Sagemaker
Sagemaker Model Monitor - Best Practices and gotchas
How to detect drift and resolve issues in you Machine Learning models?
Top 6 ML Engineer Interview Questions (with Snapchat MLE)
What is Vertex AI?
5.0 / 5 (0 votes)