Komparasi Kategorik Part 1
Summary
TLDRThe video provides a comprehensive guide on analyzing categorical, independent data using Chi-square and related tests. It explains the difference between paired and unpaired data, demonstrates how to structure contingency tables, and highlights the importance of expected counts for valid statistical results. Using practical examples like smoking status versus periodontal health, it guides viewers through SPSS steps for crosstab analysis, chi-square calculations, and interpreting outputs. Emphasis is placed on proper coding of variables, minimum sample requirements per cell, and the correct reading of statistical results. Overall, it equips researchers with clear, practical insights for robust categorical data analysis.
Takeaways
- 😀 Chi-square tests are commonly used to compare categorical variables, especially when dealing with proportions or percentages between groups.
- 😀 Understanding how to read the results of a chi-square test is crucial, as it involves interpreting expected counts and comparing them to actual counts in the contingency table.
- 😀 For statistical analysis, consistency in coding variables (e.g., 0 for 'no smoking' and 1 for 'smoking') is important for clarity and accurate results.
- 😀 In cases where expected counts are less than 5, the chi-square test may require a continuity correction to avoid misleading results.
- 😀 A contingency table can be two-way (2x2) or more complex (e.g., 3x3), and it shows the relationship between two categorical variables.
- 😀 The expected count should be greater than 5 for each cell in a contingency table to ensure the validity of the chi-square test. If it's less, alternative tests like Fisher's Exact Test may be used.
- 😀 Continuity correction is necessary when some expected counts are below 5 in a 2x2 contingency table to adjust the chi-square value and avoid inaccuracies.
- 😀 Descriptive statistics and cross-tabulation (crosstab) are used to summarize and organize the data before conducting a chi-square test.
- 😀 When working with categorical data in research, it's essential to ensure that your data is consistent and meets the necessary conditions for statistical testing.
- 😀 The chi-square test is used to test hypotheses about the independence of two categorical variables, with a focus on comparing the proportions of different categories.
- 😀 Interpretation of chi-square results includes checking whether the p-value indicates a significant difference between categories, which may lead to conclusions about the relationship between variables.
Q & A
What is the main purpose of categorical comparative analysis discussed in the video?
-The main purpose is to compare proportions or percentages between groups of categorical data, such as analyzing differences in health status between smokers and non-smokers.
What statistical tests are commonly used for non-paired categorical data?
-The Chi-Square test is commonly used, and for cases with small expected counts, Fisher’s Exact Test is often applied.
How does categorical analysis differ from numerical analysis?
-Numerical analysis compares means or medians between groups, while categorical analysis compares proportions or counts of categories within groups.
What is an 'expected count' and why is it important?
-An expected count is the predicted frequency for each cell in a contingency table assuming no association between variables. It is important because Chi-Square tests require most expected counts to be ≥5 to be valid.
When should continuity correction be applied?
-Continuity correction should be applied for 2×2 tables with small sample sizes to adjust the Chi-Square test and reduce bias.
What are the steps to perform a Chi-Square test in SPSS for categorical data?
-1) Enter data and define independent/dependent variables. 2) Click Descriptive Statistics → Crosstabs. 3) Assign variables to rows and columns. 4) Click Statistics → Chi-Square and select Continuity Correction if needed. 5) Click Cells → select Observed and Percentages. 6) Click OK to generate output.
How should the SPSS output for a Chi-Square test be interpreted?
-Focus on the observed counts and percentages. Check expected counts for validity, and determine significance from the Chi-Square value and p-value. Continuity corrections are considered if applied.
What are the coding recommendations for categorical variables?
-Codes should be consistent and meaningful. For example, 1 = smoker, 2 = non-smoker; 1 = sick, 2 = healthy. Avoid mixing unrelated numbers or using inconsistent coding.
What should a researcher do if expected counts are below 5 in more than 20% of cells?
-In this case, the Chi-Square test may not be valid, and the researcher should use Fisher’s Exact Test instead.
How does the video suggest reporting Chi-Square results in a research paper?
-Report the observed counts, percentages, Chi-Square value, degrees of freedom, and p-value. Emphasize that statistics are tools and should be interpreted in the context of the study’s substance.
What are common challenges when reading Chi-Square outputs?
-Challenges include identifying which cells have low expected counts, understanding continuity correction, and interpreting percentages in context. Misreading these can lead to incorrect conclusions.
Why is it important to consider the substance of the research in addition to statistical results?
-Because even if statistical tests indicate significance or non-significance, the actual implications depend on research design, sample size, and real-world relevance. Statistics alone do not determine meaningful conclusions.
Outlines

هذا القسم متوفر فقط للمشتركين. يرجى الترقية للوصول إلى هذه الميزة.
قم بالترقية الآنMindmap

هذا القسم متوفر فقط للمشتركين. يرجى الترقية للوصول إلى هذه الميزة.
قم بالترقية الآنKeywords

هذا القسم متوفر فقط للمشتركين. يرجى الترقية للوصول إلى هذه الميزة.
قم بالترقية الآنHighlights

هذا القسم متوفر فقط للمشتركين. يرجى الترقية للوصول إلى هذه الميزة.
قم بالترقية الآنTranscripts

هذا القسم متوفر فقط للمشتركين. يرجى الترقية للوصول إلى هذه الميزة.
قم بالترقية الآنتصفح المزيد من مقاطع الفيديو ذات الصلة

BAB V STATISTIKA NON PARAMETRIK|INDEPENDENT SAMPLE|STATISTIKA TERAPAN|Part II
Chi-Square Tests: Crash Course Statistics #29

Chi-Square Test [Simply explained]

UJI CHI-SQUARE TEORI DAN CONTOH KASUS PART 1
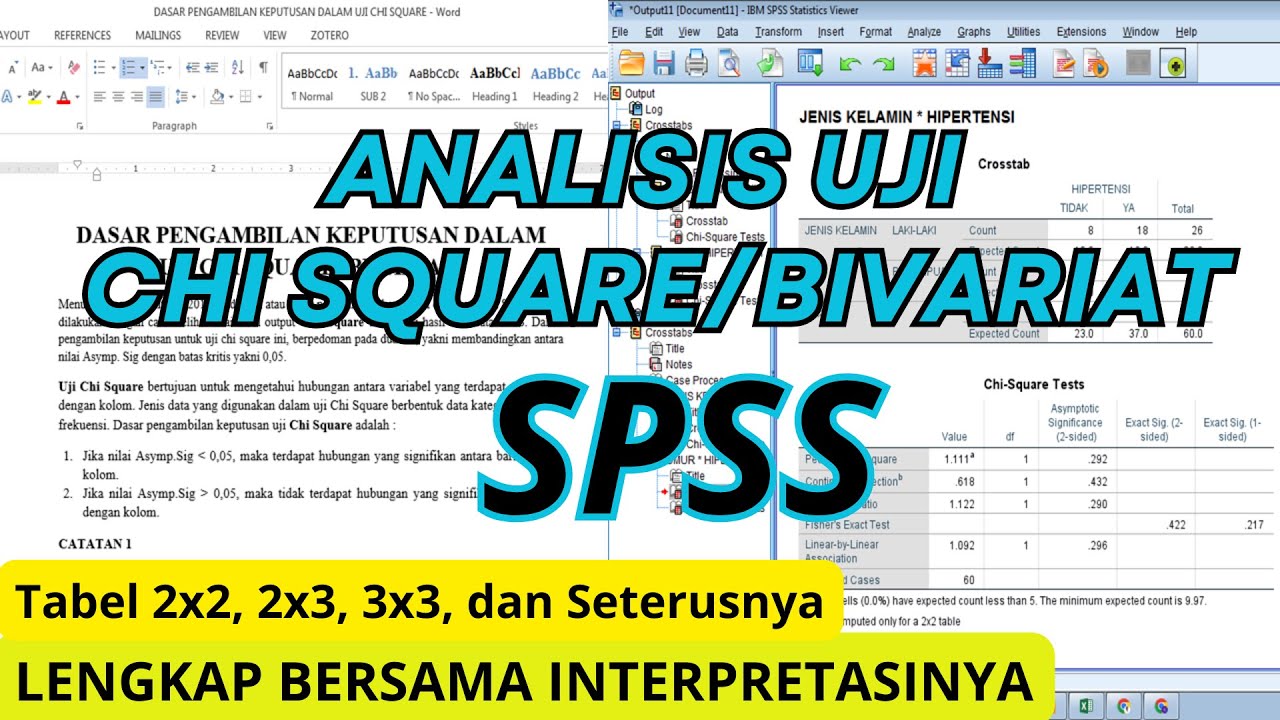
Analisis Chi Square dengan aplikasi SPSS

Video Tutorial Cara Uji Chi Square/Chi Kuadrat dengan Program SPSS
5.0 / 5 (0 votes)
