Learn 80% of Data Analysis in Excel in Just 12 Minutes
Summary
TLDRThis tutorial demonstrates how to efficiently analyze Olympic data in Excel, focusing on data cleaning, transformation, and analysis. Key steps include organizing the data into a table, removing duplicates, replacing terms, and filling missing values. The analysis involves creating pivot tables to answer questions about the most common disciplines, the countries with the most medals, and visualizing data with charts. Additionally, the video highlights tools like the Trim function and the importance of using Power Query for faster, more efficient analysis. The tutorial also touches on learning other tools like SQL, Power BI, and Python for aspiring data analysts.
Takeaways
- 😀 80% of data analysis in Excel can be learned in just a few minutes by focusing on four core steps.
- 😀 Always create a backup of the original data by duplicating the worksheet to avoid accidental mistakes.
- 😀 Converting data into a table (Ctrl + T) in Excel makes it easier to manage and manipulate.
- 😀 Removing duplicate rows is a crucial first step in cleaning your data using the 'Remove Duplicates' feature.
- 😀 Use Excel's 'Replace' feature to make column data easier to understand, such as replacing 'game team' with 'team'.
- 😀 The 'Go To Special' feature allows for efficient bulk editing of blank cells, such as replacing blanks with 'team' in a team sport.
- 😀 Excel functions like 'Proper' and 'Trim' can help clean data by fixing capitalization and removing extra spaces.
- 😀 Pivot tables are powerful tools for analyzing data, such as counting the number of team vs. individual sports.
- 😀 Sorting and filtering in pivot tables helps answer key questions, such as identifying the most popular sports and disciplines.
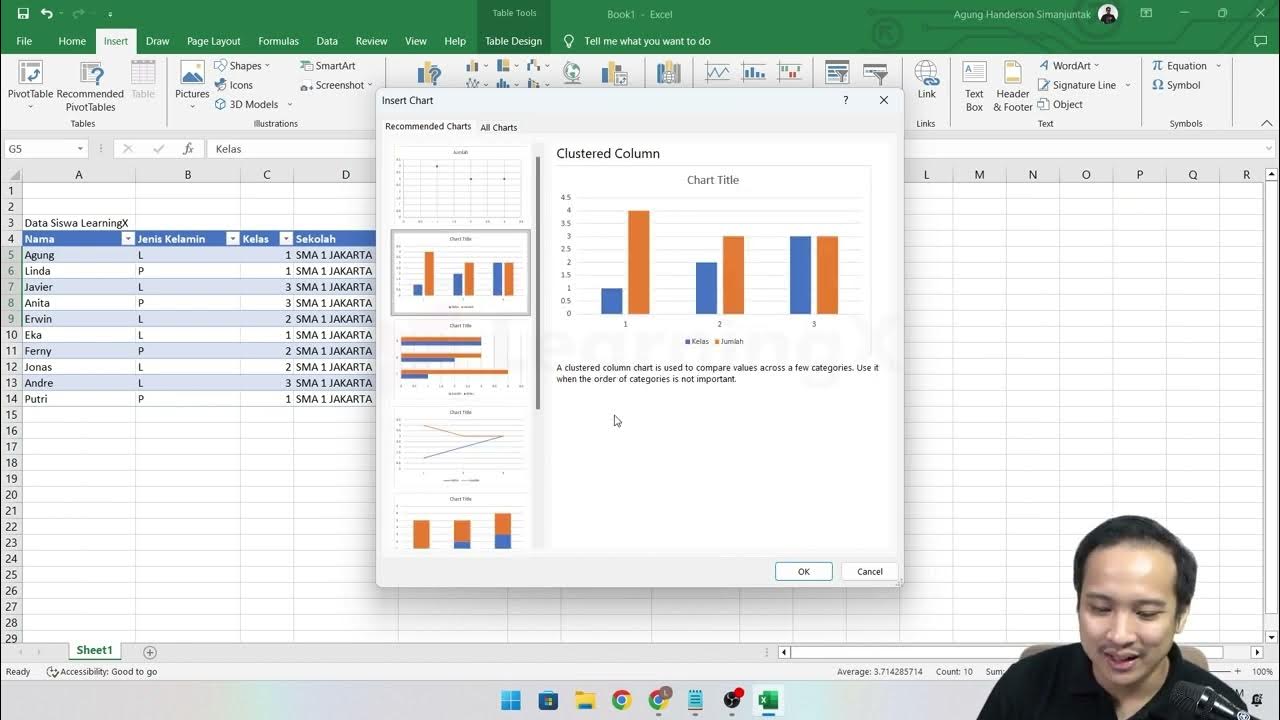
- 😀 Visualization of data using Excel charts, such as a stacked column chart, helps make insights more accessible and interpretable.
- 😀 Slicers can be added to pivot tables to allow dynamic filtering of data, making your analysis more interactive.
Q & A
What are the four core steps involved in data analysis in Excel?
-The four core steps involved in data analysis in Excel are: 1) Cleaning the data, 2) Transforming the data, 3) Analyzing the data, and 4) Visualizing the data.
Why is it important to work on the original data in Excel?
-It is important to work on the original data in Excel to ensure that you can always revert to the unaltered version if any mistakes are made during analysis. This can be achieved by creating a duplicate of the original data.
How can you remove duplicate rows in Excel?
-To remove duplicate rows in Excel, you can go to the 'Data' tab and click on the 'Remove Duplicates' button. This will eliminate any duplicate entries in the dataset.
What does converting a dataset into a table in Excel do?
-Converting a dataset into a table in Excel helps organize the data better and provides features like drop-down filters, automatic data expansion, and easier formatting, making it more manageable for analysis.
How can you replace values in a specific column using Excel?
-You can replace values in a specific column in Excel by selecting the column, then pressing 'Ctrl + H' to open the 'Find and Replace' tool. Enter the value you want to find and the value you want to replace it with, and then click 'Replace All'.
What is the 'Go To Special' feature in Excel and how is it useful?
-The 'Go To Special' feature in Excel allows you to quickly select specific types of data, such as blanks. This is useful for bulk actions, such as filling all blank cells with a specific value.
What function can be used in Excel to ensure text is properly capitalized?
-The 'PROPER' function in Excel converts the first letter of each word in a text string to uppercase and the rest to lowercase, ensuring proper capitalization.
What is the advantage of using Power Query over standard Excel functions for data transformation?
-Power Query allows for faster, more efficient, and scalable data transformation compared to traditional Excel functions. It provides advanced features like automated data cleaning, merging, and transformation tasks that are difficult to achieve with regular Excel tools.
How can you use pivot tables to analyze Olympic data by type of discipline?
-You can use a pivot table to count the occurrences of different disciplines by adding the 'Type' column as a value and using it to get the count of team vs. individual sports. You can then sort and filter the data to focus on specific categories.
What is the purpose of a slicer in Excel, and how can it be used with pivot tables?
-A slicer is a visual filter tool in Excel that allows users to filter data in pivot tables dynamically. It provides an easy way to select and view specific categories, like filtering by 'Games' to focus on specific Olympic events.
How can you visualize the total medal counts of countries using Excel?
-You can visualize the total medal counts of countries by creating a pivot table and then adding the 'Country' as rows and the 'Medals' as values. After organizing and sorting the data, you can create a chart (e.g., clustered column chart) to visually represent the medal distribution.
How can you find out how many medals a specific country won in Excel?
-You can find out how many medals a specific country won by using a filter function or by creating a pivot table. In a formula, you can use the 'FILTER' function to extract data specific to the country and then count the results.
Outlines

هذا القسم متوفر فقط للمشتركين. يرجى الترقية للوصول إلى هذه الميزة.
قم بالترقية الآنMindmap

هذا القسم متوفر فقط للمشتركين. يرجى الترقية للوصول إلى هذه الميزة.
قم بالترقية الآنKeywords

هذا القسم متوفر فقط للمشتركين. يرجى الترقية للوصول إلى هذه الميزة.
قم بالترقية الآنHighlights

هذا القسم متوفر فقط للمشتركين. يرجى الترقية للوصول إلى هذه الميزة.
قم بالترقية الآنTranscripts

هذا القسم متوفر فقط للمشتركين. يرجى الترقية للوصول إلى هذه الميزة.
قم بالترقية الآنتصفح المزيد من مقاطع الفيديو ذات الصلة
Chapter 5 - Tutorial Analisa Data Part 1 (COUNT IF)

Cleaning Data in Excel | Excel Tutorials for Beginners

Web scraper dasar (single page)
Cara Memasukkan Data Awal Sampai Pengolahan Data dari Excel ke SPSS

VLOOKUP pada Pivot Table Excel

These are the ONLY 15 functions you need to know in Excel (to get most things done)
5.0 / 5 (0 votes)
