NVDA Stock - Crucial Level For NVIDIA
Summary
TLDRIn this Nvidia daily update, the speaker analyzes the stock's recent movements, particularly after-hours performance driven by Google’s earnings. They discuss technical factors like the 9 EMA, MACD, and key support and resistance levels around $165 and $174. While the stock's momentum appears slightly faded, the overall trend remains bullish. Short-term bearishness could be a bullish retracement, potentially leading to a higher trend. The speaker highlights key price points, emphasizing the importance of monitoring the $172–$174 range, as a breakout could unlock further upside to $180.
Takeaways
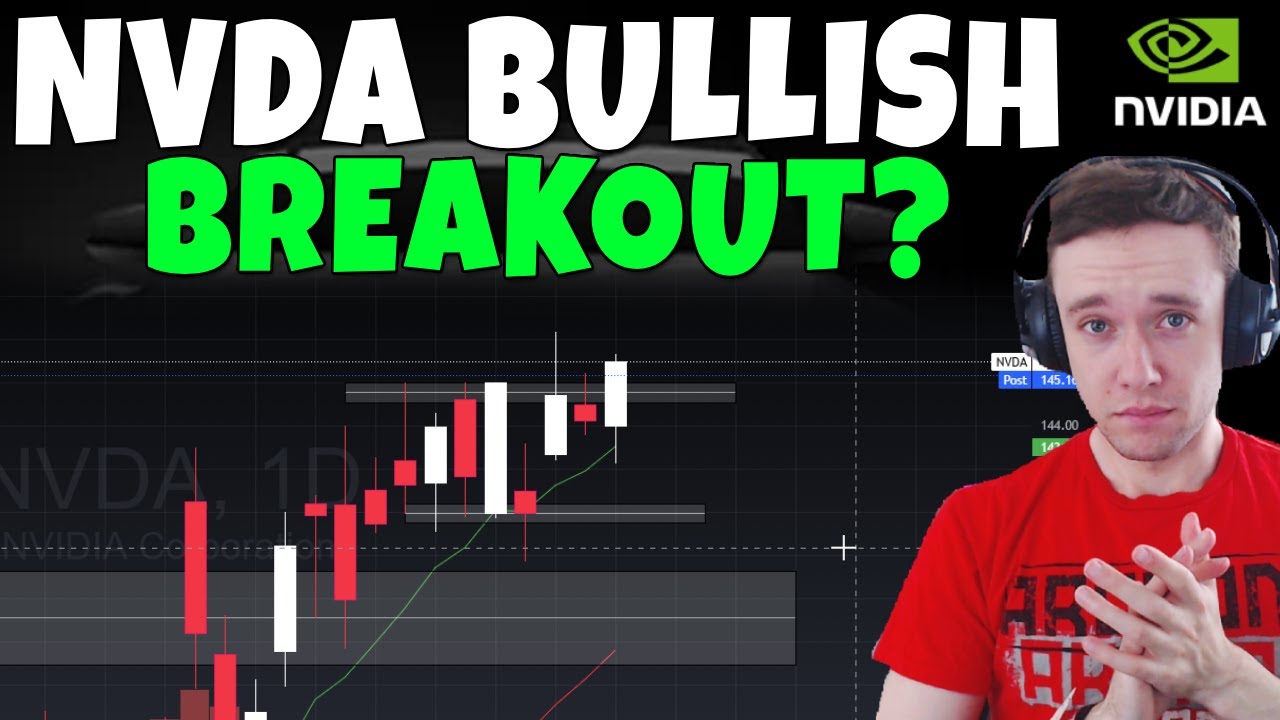
- 😀 Nvidia stock saw a 1% increase after hours, likely driven by Google's earnings report, which included a significant increase in capex spending.
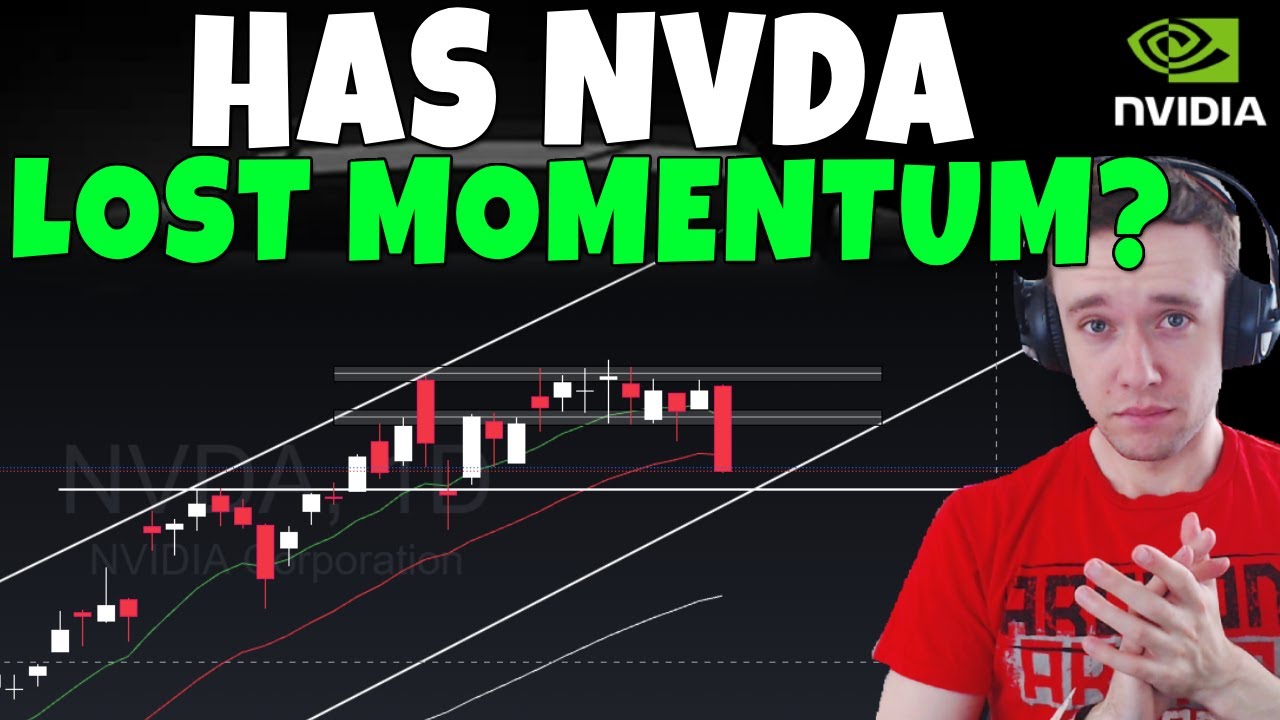
- 😀 The stock had a small red flag yesterday with a candle closing below the 9 exponential moving average, signaling potential fading momentum.
- 😀 Despite the recent red flag, the overall momentum for Nvidia remains bullish, with the stock still above key moving averages and MACD in the green.
- 😀 If Nvidia's stock loses the support at $165, it could lead to a further drop towards the 21 EMA, potentially reaching low $150s in the future.
- 😀 Short-term bearish movements in Nvidia could be viewed as a bullish retracement, not a signal for an impending crash.
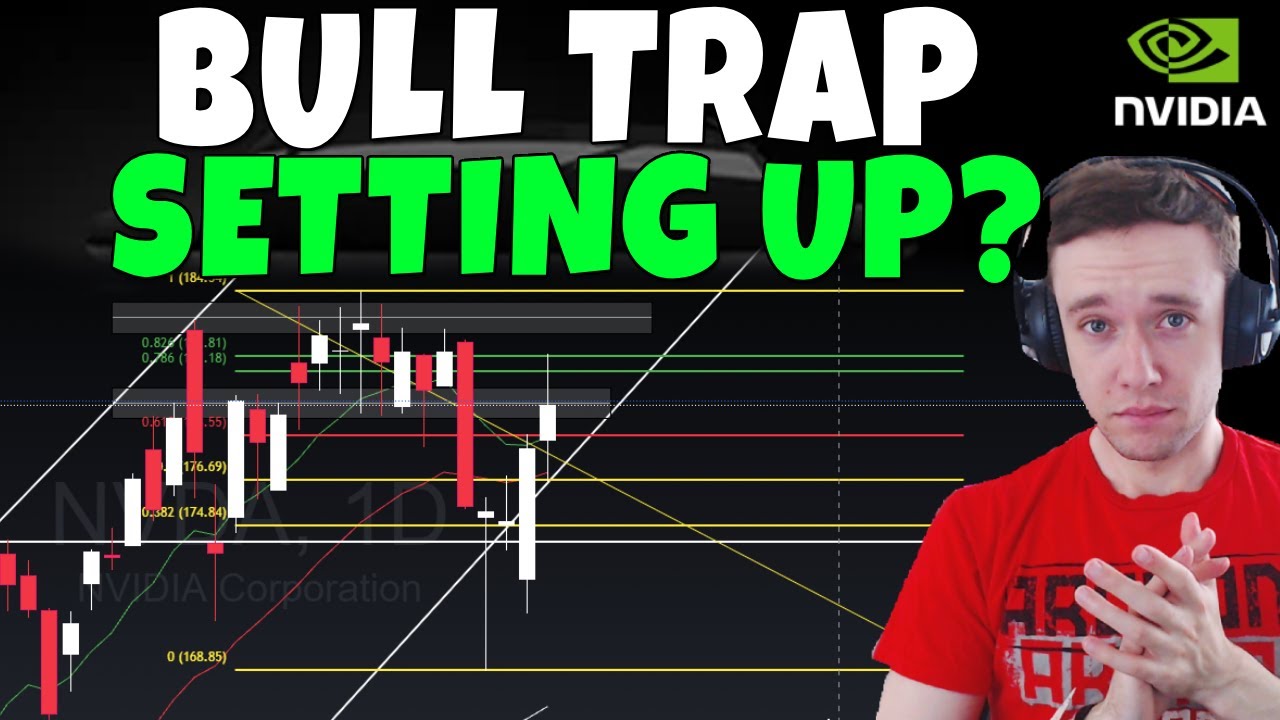
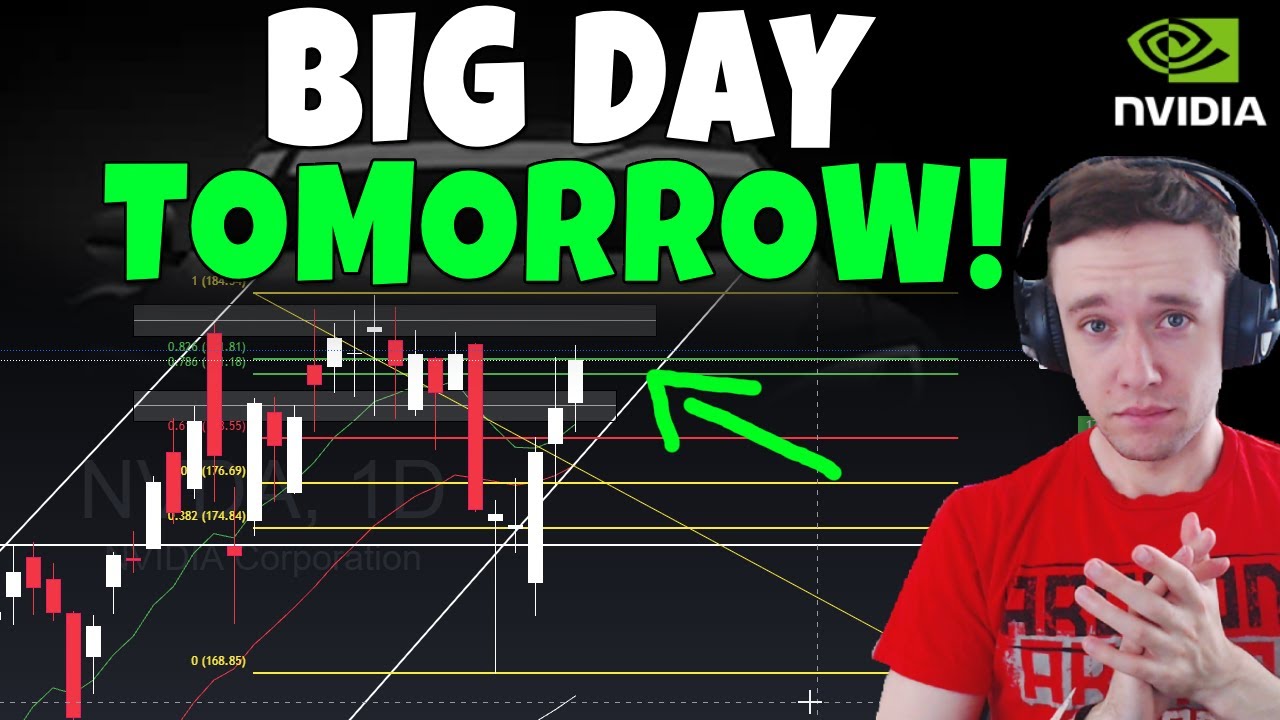
- 😀 A key resistance level for Nvidia is at $174, and if the stock reclaims this level, it could push the price towards $179-$180 per share.
- 😀 The recent 1% gap up after hours indicates potential short-term volatility and the need to monitor if the momentum continues or fades.
- 😀 There’s a possibility of a 'dead cat bounce' around the $172 resistance level, which could lead to a retest of previous lows in the short term.
- 😀 The MACD indicator shows elevated momentum, but the stock's near-term direction depends on whether the 172-173 zone holds as resistance or breaks.
- 😀 The options flow data suggests bulls are still dominating, but there is some bearish sentiment, which makes the $172 resistance level critical to watch.
- 😀 Overall, the stock is still in a strong bullish uptrend, but caution is needed in the short term as the market reacts to earnings reports and resistance levels.
Q & A
What triggered Nvidia's stock increase in after-hours trading?
-Nvidia's stock increased by 1% after hours, likely due to Google's earnings report, where Google raised its capex spending by about $10 billion, which is seen as positive news for Nvidia.
What does the recent candle closing below the 9 exponential moving average (EMA) signify?
-The candle closing below the 9 EMA for the first time in a while is a small red flag. While it doesn’t immediately imply a crash, it suggests that momentum might be fading, indicating that the stock's upward movement could be limited.
How does the MACD indicator relate to Nvidia's current stock performance?
-The MACD (Moving Average Convergence Divergence) is elevated, indicating strong momentum. However, if the MACD starts to turn red, it would confirm that momentum has faded. Despite this, a false breakdown similar to previous instances might occur, where the stock could still go higher.
What happens if Nvidia's stock price drops below $165?
-If Nvidia’s stock drops below $165, it would be a red flag, as it would signal a breakdown of both a support level and the 21 EMA. This could lead to a further decline, potentially reaching the low 150s.
How can a short-term bearish trend affect Nvidia’s stock in the long term?
-Short-term bearish trends, like retracements, can actually create bullish situations in the longer term. This is because such trends might be part of a larger bullish pattern, where the stock ultimately rebounds and moves higher.
What resistance level should investors watch for an upward breakout in Nvidia’s stock?
-The key resistance level to watch is around $174. If Nvidia can break above this level and turn it into support, the stock could move towards $179–$180.
What is a potential risk if Nvidia's stock fails to maintain the $172 resistance zone?
-If Nvidia’s stock struggles to stay above the $172 resistance zone, it could lead to a dead cat bounce, where the stock falls back to retest lower levels, possibly around the $165 support zone.
How does the Fibonacci retracement level influence Nvidia’s stock movement?
-The Fibonacci retracement levels provide key support and resistance zones. A resistance zone near $172 could indicate a potential dead cat bounce, while reclaiming levels above $174 could lead to further upside potential toward $179–$180.
What are the implications of Nvidia’s current bullish momentum despite some short-term bearish signals?
-Despite some short-term bearish signals, Nvidia’s overall momentum remains bullish. The stock is still above important moving averages, and while a short-term retracement could occur, the long-term trend remains positive, with potential for further growth.
What role does options flow play in Nvidia's stock outlook?
-Options flow shows that the bulls are dominating, with a significant call option for $175 expiring on August 15th. This suggests that investors are betting on continued upward movement for Nvidia, reinforcing the overall bullish sentiment.
Outlines

هذا القسم متوفر فقط للمشتركين. يرجى الترقية للوصول إلى هذه الميزة.
قم بالترقية الآنMindmap

هذا القسم متوفر فقط للمشتركين. يرجى الترقية للوصول إلى هذه الميزة.
قم بالترقية الآنKeywords

هذا القسم متوفر فقط للمشتركين. يرجى الترقية للوصول إلى هذه الميزة.
قم بالترقية الآنHighlights

هذا القسم متوفر فقط للمشتركين. يرجى الترقية للوصول إلى هذه الميزة.
قم بالترقية الآنTranscripts

هذا القسم متوفر فقط للمشتركين. يرجى الترقية للوصول إلى هذه الميزة.
قم بالترقية الآن

5.0 / 5 (0 votes)
