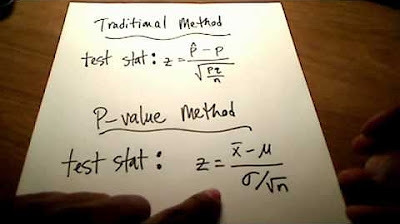
Uji Hipotesis part 2 (Prosedur Pengujian Hipotesis, Statistik Uji, Wilayah Tolak/ Kritis)

The Tama Eleven
27 Jun 202008:35

Summary

TLDRThis lecture transcript delves into hypothesis testing in statistics, outlining the procedure involving the determination of null and alternative hypotheses, significance level, and test statistic calculation. It explains the use of Z-test statistics for large sample size and unknown population variance, demonstrating the formula and decision-making process based on critical regions and p-values. The transcript also covers one-tailed and two-tailed tests, highlighting the decision to reject the null hypothesis based on the test's direction and p-value comparison with the significance level.

Takeaways

  • 📚 The lecture continues the discussion on hypothesis testing, focusing on four main points: the testing procedure, the test statistic, the critical region, and decision-making based on the hypothesis.
  • 🔍 The first step in hypothesis testing is to define the null hypothesis (H0) and the alternative hypothesis (Ha).
  • 📈 The significance level, or alpha (α), is determined, which is the probability of rejecting the null hypothesis when it is true.
  • 📊 The test statistic is calculated, which is a function of the random variable used in the hypothesis test.
  • ⚖️ The critical region or rejection region is determined, which is the range of values for the test statistic that leads to the rejection of the null hypothesis.
  • 🧐 The decision to reject or not reject the null hypothesis is made based on whether the calculated test statistic falls within the critical region.
  • 📉 For a one-tailed left hypothesis test, the critical region is to the left, and the decision to reject H0 is made if the test statistic is less than the critical value.
  • 📈 For a one-tailed right hypothesis test, the critical region is to the right, and H0 is rejected if the test statistic is greater than the critical value.
  • 🔢 The p-value is used to make decisions in hypothesis testing, representing the probability of observing a test statistic as extreme or more extreme than the one calculated, assuming the null hypothesis is true.
  • 🔄 For a two-tailed hypothesis test, the critical region is split into two tails, one on each side of the distribution, and H0 is rejected if the test statistic falls in either tail.
  • 📚 The lecture also mentions different types of test statistics such as Z-test, t-test, F-test, and chi-square test, each used depending on the hypothesis about the parameter being tested.

Q & A

  • What are the four main topics covered in this lecture about hypothesis testing?

    -The four main topics covered are the procedure of hypothesis testing, test statistics, critical region, and decision-making from the hypothesis.

  • What is the first step in the procedure of hypothesis testing?

    -The first step is to determine the null hypothesis (H0) and the alternative hypothesis (Ha).

  • How is the significance level (alpha) used in hypothesis testing?

    -The significance level (alpha) is used to determine the critical region where the null hypothesis will be rejected.

  • What is the formula for the Z-test statistic when the population variance is unknown?

    -The Z-test statistic is calculated using the formula: (x̄ - μ0) / (s / √n), where x̄ is the sample mean, μ0 is the null hypothesis mean, s is the sample standard deviation, and n is the sample size.

  • What are some examples of different test statistics used in hypothesis testing?

    -Examples of different test statistics include Z-test, t-test, F-test, and chi-square test.

  • How is the critical region for a left-tailed test determined?

    -For a left-tailed test, the critical region is on the left side of the distribution and is determined by the significance level alpha, with the critical value found from the Z-table.

  • What decision is made if the Z-test statistic falls within the critical region?

    -If the Z-test statistic falls within the critical region, the null hypothesis (H0) is rejected.

  • What does a p-value represent in hypothesis testing?

    -The p-value represents the probability of obtaining a test statistic at least as extreme as the one observed, under the assumption that the null hypothesis is true.

  • How do you interpret a p-value less than the significance level alpha?

    -If the p-value is less than the significance level alpha, the null hypothesis (H0) is rejected.

  • What is the difference between a one-tailed and a two-tailed test in hypothesis testing?

    -A one-tailed test has the critical region on one side of the distribution, either left or right, while a two-tailed test has the critical region divided between both sides of the distribution.

Outlines

00:00

📚 Introduction to Hypothesis Testing

This paragraph introduces the process of hypothesis testing in a statistics course. It outlines the steps involved, starting with the determination of the null hypothesis and alternative hypothesis, followed by the significance level (Alpha), calculation of the test statistic, and the determination of the critical region or rejection region for the null hypothesis. The paragraph also explains the use of the Z-test statistic formula for large sample sizes and unknown population variance. The Z-test is used to calculate a value that helps in making a decision to either reject or not reject the null hypothesis based on the calculated Z-score and the critical value obtained from standard normal distribution tables.

05:00

🔍 Decision Making in Hypothesis Testing

The second paragraph delves into the decision-making process in hypothesis testing, focusing on one-tailed and two-tailed tests. It explains the concept of the rejection region and how it is determined by the significance level (Alpha) and the critical value. The paragraph discusses the use of the p-value, which represents the probability of observing a test statistic as extreme or more extreme than the one calculated if the null hypothesis is true. Decisions to reject the null hypothesis are made when the p-value is less than Alpha or when the calculated test statistic falls into the rejection region. The paragraph also covers the implications of one-tailed and two-tailed tests, with the latter dividing the rejection region equally on both sides of the distribution curve, and how the decision to reject the null hypothesis is influenced by whether the test statistic is in the left or right tail of the distribution.

Mindmap

Keywords

💡Hypothesis Testing

Hypothesis testing is a statistical method used to make decisions about a population parameter based on sample data. It is central to the video's theme as it outlines the procedure for testing hypotheses. The script discusses determining the null hypothesis and alternative hypothesis, significance level, and making decisions based on the test outcomes. For example, the script mentions 'menentukan hipotesis nol dan hipotesis alternatif' which translates to 'determining the null hypothesis and alternative hypothesis'.

💡Significance Level (Alpha)

The significance level, often denoted as alpha, is the probability of rejecting the null hypothesis when it is true. It is a key concept in hypothesis testing as it helps set the threshold for decision-making. The script refers to 'tarif signifikansi' or 'significance level' when explaining the procedure to determine the critical region or rejection region for the null hypothesis.

💡Test Statistic

A test statistic is a summary of the data used to make a decision in hypothesis testing. It quantifies the evidence against the null hypothesis. The script introduces the Z-test statistic formula and explains its components, such as 'x bar' for sample mean, 'mu nol' for the hypothesized mean under the null hypothesis, and 'qspr' for the square root of the sample variance.

💡Critical Region

The critical region is the range of values for which the null hypothesis is rejected. It is determined by the significance level and the test statistic's distribution. The script discusses 'wilayah kritis' or 'critical region' in the context of making a decision to reject the null hypothesis based on the calculated test statistic.

💡Z-test

The Z-test is a statistical test used when the sample size is large and the population variance is unknown. It is a specific type of test statistic mentioned in the script with a formula that includes the sample mean, hypothesized population mean, and the standard deviation of the sample. The script provides an example of using the Z-test for hypothesis testing about the mean.

💡p-value

The p-value is the probability of observing a test statistic as extreme or more extreme than the one calculated from the sample data, assuming the null hypothesis is true. It is used to make decisions in hypothesis testing. The script explains that if the p-value is less than the significance level, the null hypothesis is rejected, as in 'nilai p-value kurang dari Alfa' which translates to 'p-value is less than alpha'.

💡One-tailed Test

A one-tailed test is a type of hypothesis test that considers extreme values in one direction only. It is related to the video's theme as it discusses the direction of the alternative hypothesis. The script mentions 'uji hipotesis 1 arah kiri' or 'one-tailed left test' and explains the decision-making process based on the calculated Z-value.

💡Two-tailed Test

A two-tailed test is a hypothesis test that considers extreme values in both directions. It is relevant to the video's content as it contrasts with the one-tailed test. The script explains that the critical region is split into two, with 'wilayah tolak' or 'rejection regions' on both ends of the distribution, each with an alpha/2 significance level.

💡Sample Mean and Sample Standard Deviation

The sample mean and sample standard deviation are statistics calculated from the sample data and used in hypothesis testing. They represent the average value and the dispersion of the sample, respectively. The script uses these terms in the context of calculating the Z-test statistic, where 'rata-rata sampel' and 'standar deviasi sampel' are the Indonesian terms for sample mean and sample standard deviation.

💡Population

In statistics, the population refers to the entire group of individuals or items of interest, from which a sample is drawn. The script mentions 'populasi' in the context of taking a sample from a population to perform hypothesis testing, such as 'ada sebuah populasi lalu kita ambil sebagian elemen dari populasi tersebut' which translates to 'there is a population and then we take some elements from that population'.

Highlights

Introduction to hypothesis testing procedures in a statistics class.

Explanation of the four main steps in hypothesis testing: determining null and alternative hypotheses, significance level, test statistic calculation, and critical region or rejection region determination.

The role of the test statistic as a random variable in hypothesis testing.

Use of the Z-test statistic formula for large sample size and unknown population variance.

Illustration of calculating sample mean and standard deviation to use in the Z-test formula.

Different types of test statistics such as Z-test, t-test, F-test, and chi-squared test, and their applications based on the hypothesis about the parameter.

Decision-making in hypothesis testing based on the test's direction: one-tailed and two-tailed tests.

The concept of the critical region or rejection region for a one-tailed left test and its relation to the significance level.

How to determine the critical value from the standard normal distribution table for a one-tailed test.

Decision-making process using the Z-calculated value and the critical value in a one-tailed left test.

Introduction to the p-value and its calculation as the area under the curve for one-tailed tests.

Decision rule using the p-value compared to the significance level (Alpha) in hypothesis testing.

The critical region for a one-tailed right test and its relation to the significance level.

Decision-making in a one-tailed right test using the Z-calculated value and the critical value.

Calculation of the p-value for a one-tailed right test and its comparison with the significance level.

Division of the rejection region for a two-tailed test and its relation to the significance level.

Decision-making process for a two-tailed test using the Z-calculated value and the critical values.

Calculation of the p-value for a two-tailed test and its comparison with the significance level.

Conclusion of the lecture with a summary of the discussed hypothesis testing concepts.

Transcripts

play00:00

halo halo sabar statistik bertemu lagi

play00:03

di channel kuliah statistik pada kuliah

play00:07

singkat hari ini kita akan melanjutkan

play00:09

pembahasan mengenai uji hipotesis ada

play00:15

empat hal yang akan dibahas pertama

play00:18

adalah prosedur Pengujian Hipotesis

play00:20

kedua statistik uji ketiga wilayah tolak

play00:25

atau wilayah kritis dan keempat cara

play00:28

pengambilan keputusan dari hipotesis

play00:33

berikut adalah prosedur Pengujian

play00:35

Hipotesis pertama kita menentukan

play00:39

hipotesis nol dan hipotesis alternatif

play00:42

kedua kita menentukan taraf signifikansi

play00:46

atau Alfan ketiga menghitung nilai

play00:50

statistik uji keempat menentukan wilayah

play00:54

kritis atau wilayah tolak h0 dan yang

play00:58

kelima mengambil

play01:00

Hai apakah kita menolak hipotesis nol

play01:02

atau gagal menolak hipotesis nol untuk

play01:06

langkah 1 dan Langkah kedua sudah kita

play01:09

bahas pada beberapa kuliah sebelumnya

play01:14

statistik kucing merupakan fungsi peubah

play01:17

acak untuk mendapatkan nilai yang

play01:21

nantinya akan kita gunakan pada

play01:23

pengujian hipotesis statistik sebagai

play01:27

contoh adalah ketika kita ingin

play01:30

melakukan pengujian hipotesis rata-rata

play01:33

untuk jumlah sampel besar dan varians

play01:37

populasi tidak diketahui maka kita bisa

play01:40

menggunakan statistik uji Z dimana

play01:44

statistik uji Z dapat kita peroleh

play01:46

dengan formulasi sebagai berikut x bar

play01:50

dikurangi new nol dibagi qspr akar n

play01:56

dimana expert adalah rata-rata Centre

play02:00

I love you nol adalah nilai rata-rata di

play02:03

bawah hipotesis nol es adalah standar

play02:07

deviasi sampel dan n adalah jumlah

play02:10

sampel yang kita gunakan sebagai

play02:14

ilustrasi ada sebuah populasi lalu kita

play02:18

ambil sebagian elemen dari populasi

play02:20

tersebut yang kita sebut sebagai sampel

play02:24

lalu nantinya dari sampel-sampel ini

play02:27

kita akan bisa menghitung rata-rata

play02:30

sampel dan standar deviasi sampel

play02:34

kemudian rata-rata sampel dan standar

play02:37

deviasi sampel kita masukkan ke dalam

play02:40

formula statistik uji Z yang nantinya

play02:43

akan menghasilkan suatu nilai yang biasa

play02:47

kita sebut sebagai Z hitung ada banyak

play02:52

statistik uji sebagai contoh adalah

play02:54

statistik uji Z tapi sip uji t-statistik

play02:58

uji F dan status

play03:00

uji qqwweerr gimana penggunaan dari

play03:03

masing-masing statistik uji tergantung

play03:06

dari hipotesis mengenai parameter Apa

play03:09

yang akan kita lakukan penentuan wilayah

play03:14

kritis atau wilayah tolak h0 dan

play03:18

pengambilan keputusan uji hipotesis

play03:20

bergantung dari arah uji hipotesis yang

play03:24

kita gunakan berikut adalah uji

play03:27

hipotesis 1 arah kiri untuk uji

play03:30

hipotesis rata-rata dengan hipotesis nol

play03:33

nya adalah hiu lebih besar sama dengan

play03:36

nol dan ha satunya new kurang dari nol

play03:41

luas dibawah kurva ini menunjukkan

play03:45

besarnya peluang kita menolak h0 dan

play03:48

juga gagal menolak h0 di bawah asumsi

play03:51

hipotesis nol benar untuk uji hipotesis

play03:55

1 arah kiri maka wilayah tolak h0 atau

play03:59

wilayah

play04:00

Ya udah di sebelah kiri dimana besarnya

play04:03

adalah Alfa atau para signifikan dengan

play04:06

batas nilai kritis Gimana nilai kritis

play04:09

Ini adalah nilai yang diperoleh dari

play04:12

tabel save tanda negatif pada nilai

play04:16

kritis dan nilai Z Drunk disebabkan

play04:19

karena nilai peubah acak pada kurva

play04:22

norma yang ada di sebelah kiri bernilai

play04:25

negatif keputusan tolak h0 kita lakukan

play04:30

jika nilai z hitung yang kita miliki

play04:33

berada pada wilayah tolak h0 atau dengan

play04:37

kata lain kita akan menolak h0 Jika

play04:40

nilai z hitung lebih kecil dari nilai

play04:44

estetis yang kita peroleh pengambilan

play04:48

keputusan juga bisa kita lihat dengan

play04:51

menggunakan nilai value dimana nilai

play04:54

p-value pada gambar merupakan luas dari

play04:58

kurva yang diarsir atau

play05:00

dengan kata lain di value bisa kita

play05:02

peroleh dari peluang ubah acak Z kurang

play05:06

dari mindset hitung ketika nilai p-value

play05:10

kurang dari Alfa atau taraf signifikan

play05:13

kita gunakan maka keputusannya adalah

play05:16

tolak h0 untuk uji hipotesis 1 arah

play05:21

kanan maka wilayah tol ada di sebelah

play05:25

kanan yaitu sebesar Alfa untuk

play05:29

pengambilan keputusan untuk uji potensi

play05:32

satu arah kanan tolak h0 Jika nilai z

play05:36

bitboom masuk ke dalam wilayah tolak

play05:38

atau dengan kata lain ketika zat hitung

play05:42

lebih besar daripada nilai kritis atau Z

play05:46

al-fath maka keputusannya adalah tolak

play05:48

h0 pengambilan keputusan bisa juga

play05:51

dilihat dari value-nya dimana besarnya

play05:55

PBNU adalah luas dari wilayah kurva yang

play05:59

diarsir

play06:00

Hai atau dengan kata lain besarnya

play06:02

p-value dapat dicari dengan peluang ubah

play06:07

acak Z Lebih dari set itu ketika nilai

play06:11

p-value kurang dari taraf signifikansi

play06:14

atau Alfa maka keputusannya adalah tolak

play06:18

h0 untuk uji hipotesis dua arah maka

play06:22

wilayah tolaknya dibagi dua yaitu di

play06:26

sebelah kiri sebesar Alfa berdua dengan

play06:29

nilai kritis mindset Alfa Berdua dan

play06:31

sebelah kanan sebesar Alfa berdua dengan

play06:34

nilai kritis cetak paper 20 pengambilan

play06:38

keputusan-keputusan tolak h0 ada dua

play06:41

kemungkinan yaitu ketika nilai z

play06:44

hitungnya masuk ke wilayah tolak sebelah

play06:47

kiri atau ketika di rezeki hitungnya

play06:50

masuk ke wilayah tolak sebelah kanan

play06:52

untuk keputusan tolak h0 ketika digebet

play06:56

hitung yang masuk ke wilayah tolak

play06:58

sebelah kiri sama saja

play07:00

ah ketika Insert hitung kurang dari

play07:03

mindset Alfa berdua keputusannya adalah

play07:05

tolak h0 untuk keputusan tolak h0 ketika

play07:10

nilai z gitu Masuk ke wilayah kalau

play07:12

sebelah kanan sama saja yaitu ketika

play07:15

nilai z hitung lebih besar daripada

play07:17

nilai z Alfa berdua secara matematis

play07:21

maka dapat dituliskan bahwa ketika

play07:24

nilainya hitung dalam tanda mutlak lebih

play07:27

besar daripada nilai kritis atau ZL

play07:30

wallpaper 2 maka keputusannya adalah

play07:33

tolak h0 untuk pengambilan keputusan

play07:36

dapat juga kita melihat dari nilai

play07:38

p-value ketika nilai z hitung masuk

play07:42

wilayah tolak h0 sebelah kiri maka

play07:44

p-value ja sama saja dengan mencari

play07:48

peluang peubah acak Z kurang dari

play07:51

mindset hitung dikali 2 ketika nilai set

play07:56

hitung masuk ke wilayah tolak sebelah

play07:58

kanan maka Evelyn

play08:00

sama saja Mencari peluang peubah acak Z

play08:03

lebih besar dari Z hitung dikali 2

play08:06

ketika nilai p-value kurang dari taraf

play08:09

signifikan atau Alfan digunakan maka

play08:12

keputusannya adalah tolak h0 baik Cukup

play08:16

sekian kuliah singkat kita pada hari ini

play08:19

untuk pembahasan mengenai uji hipotesis

play08:22

pada bagian berikutnya kita akan

play08:25

membahas mengenai uji hipotesis

play08:27

rata-rata uji hipotesis varians dan uji

play08:30

hipotesis proporsi Indonesia

Rate This

5.0 / 5 (0 votes)

الوسوم ذات الصلة
Hypothesis TestingStatistics EducationSignificance LevelCritical RegionDecision MakingZ-StatisticT-StatisticF-StatisticChi-Square TestSample MeanPopulation Variance
هل تحتاج إلى تلخيص باللغة الإنجليزية؟