Sistem Pertidaksamaan Linear Dua Variabel
Summary
TLDRIn this video, the speaker provides a thorough explanation of solving linear inequalities in two variables. The lesson covers the key steps to identify the solution set, including graphing the inequalities on the Cartesian plane, finding intercepts, and testing points. The speaker also demonstrates multiple examples, showing how to determine the feasible region of solutions based on the inequality signs. By using step-by-step instructions, the tutorial aims to help viewers understand how to represent and solve systems of linear inequalities effectively. The lesson emphasizes the importance of practice and encourages viewers to seek clarification if needed.
Takeaways
- 😀 The video introduces the concept of linear inequalities in two variables, explaining their definition and mathematical representation.
- 😀 Linear inequalities involve two variables (like X and Y) with the highest powers being one, connected by inequality signs (such as <, ≤, >, ≥, and ≠).
- 😀 There are five main inequality signs used in linear inequalities: less than, less than or equal to, greater than, greater than or equal to, and not equal to.
- 😀 The general form of a linear inequality in two variables is presented, such as AX + BY ≤ C or AX + BY > C.
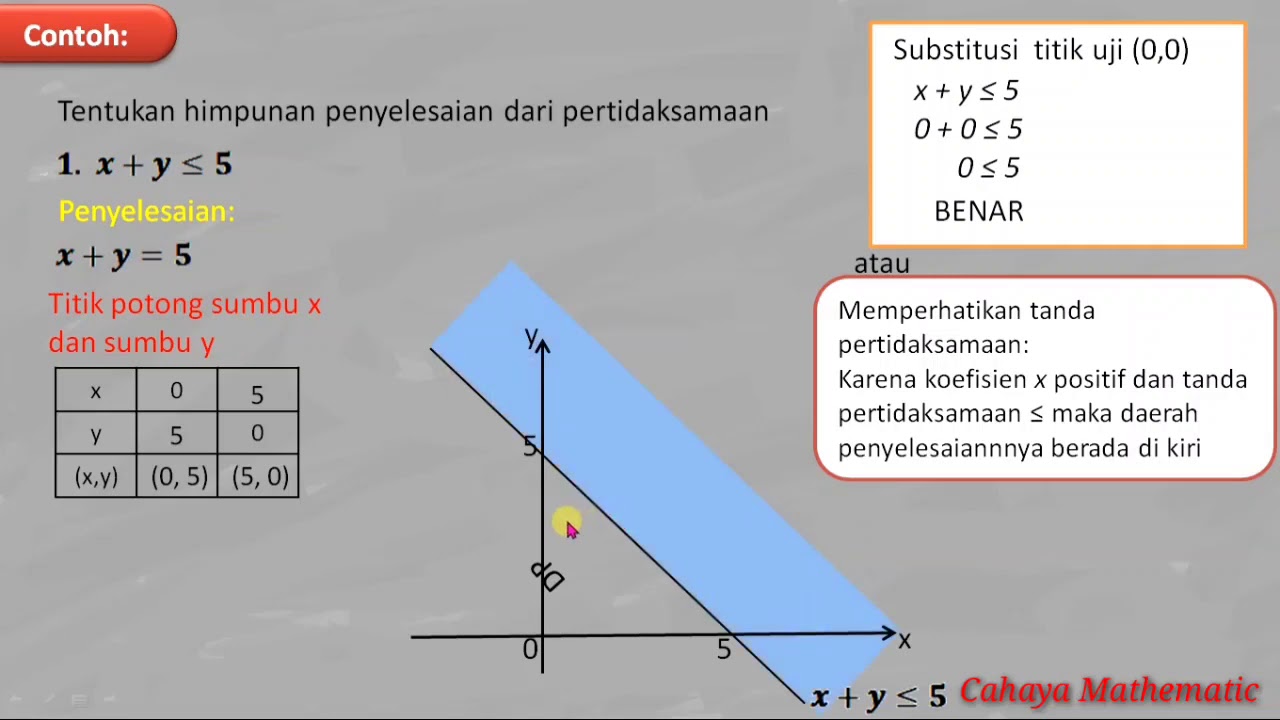
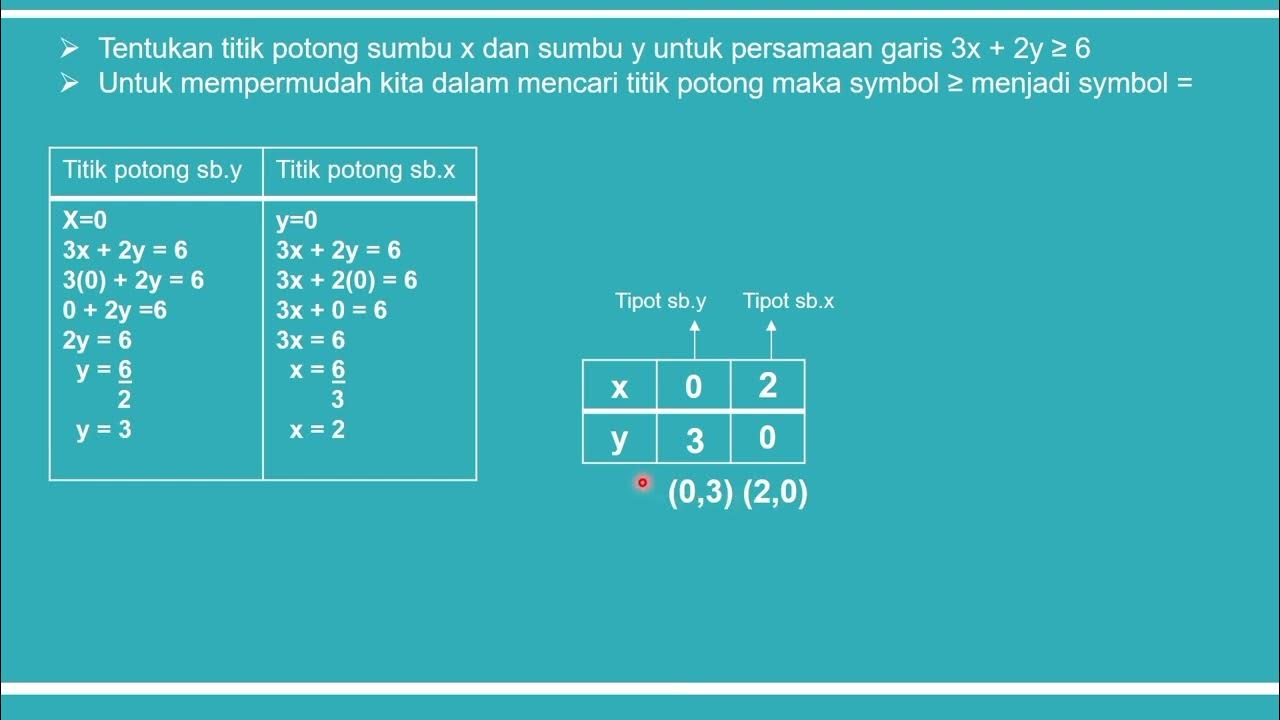
- 😀 The first step in solving linear inequalities is to convert the inequality into an equation and plot the graph of the corresponding equation (AX + BY = C).
- 😀 The intersection points with the X and Y axes are found by substituting 0 for the other variable (X = 0 for Y-axis, Y = 0 for X-axis).
- 😀 After plotting the equation on a Cartesian plane, a test point is chosen to determine which side of the line represents the solution set.
- 😀 The region that satisfies the inequality is shaded to indicate the solution set. If the test point satisfies the inequality, that region is part of the solution set.
- 😀 The process of solving systems of linear inequalities involves finding intersections and shading the correct solution region based on the inequalities.
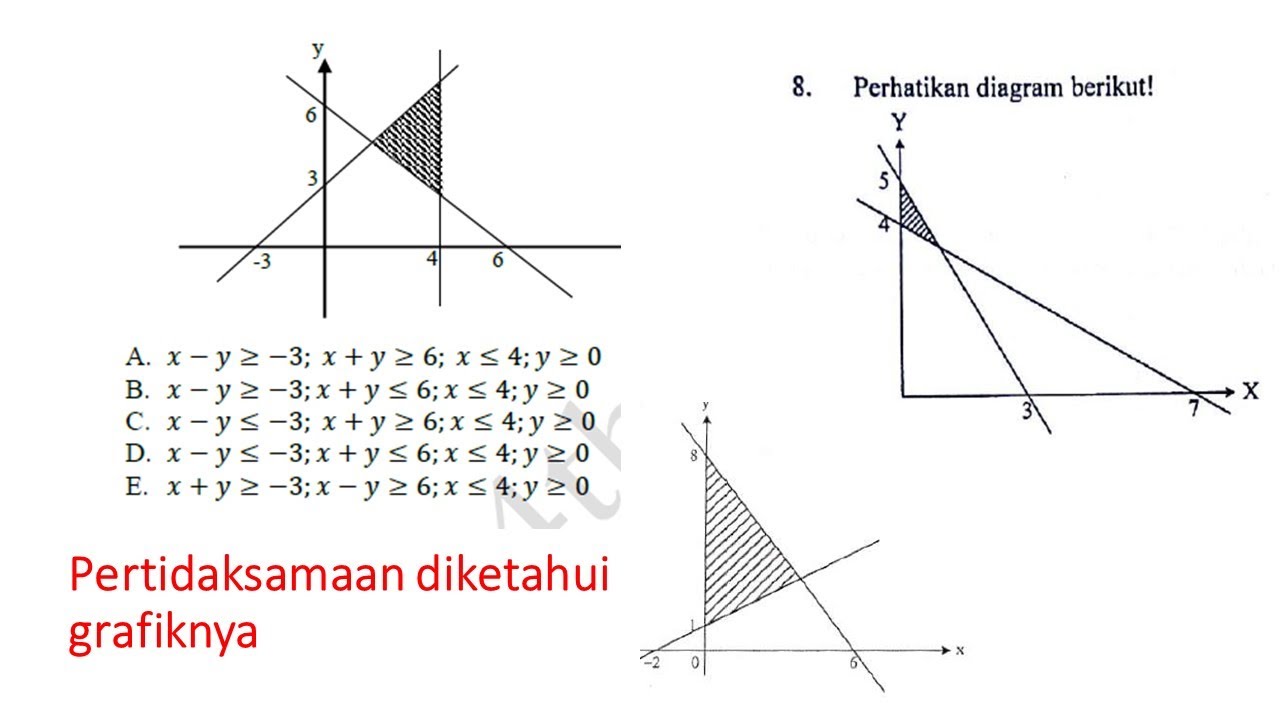
- 😀 A worked example is provided with a system of inequalities, where the solution is found by graphing each inequality and determining the overlapping region as the solution set.
Q & A
What is the main topic of the script?
-The main topic of the script is about solving systems of linear inequalities with two variables, explaining how to determine the solution regions graphically.
What is a linear inequality in two variables?
-A linear inequality in two variables is a mathematical expression involving two variables (like X and Y) where the highest power of each variable is 1, and the inequality is connected by one of the five inequality signs: less than (<), less than or equal to (≤), greater than (>), greater than or equal to (≥), or not equal to (≠).
What are the key steps to solving a system of linear inequalities?
-The key steps include: 1) Transform the inequality into an equation, 2) Graph the equation on a Cartesian plane, 3) Identify the points where the graph intersects the X and Y axes, 4) Choose a test point and check the inequality, 5) Shade the correct region to find the solution.
What is the first step in solving a linear inequality graphically?
-The first step is to transform the inequality into an equation by replacing the inequality sign with an equality sign, which represents the boundary line or curve.
How do you determine the points of intersection with the X and Y axes?
-To find the intersection with the X-axis, set Y = 0 and solve for X. To find the intersection with the Y-axis, set X = 0 and solve for Y.
What do you do after finding the points of intersection?
-After finding the points of intersection, plot them on the Cartesian plane, draw the line connecting them, and use the line to determine which side represents the solution region.
What is the role of the test point in solving the system of inequalities?
-The test point is chosen arbitrarily, and its coordinates are substituted into the inequality to check whether it satisfies the inequality. This helps determine which side of the boundary line or curve represents the solution region.
What happens if the test point satisfies the inequality?
-If the test point satisfies the inequality, then the region that includes the test point is the solution region, and it should be shaded on the graph.
How do you handle multiple inequalities in a system?
-For a system of inequalities, each inequality is graphed individually. The solution to the system is the overlapping region that satisfies all inequalities in the system.
What does it mean when a region is shaded on the graph?
-Shading a region on the graph represents the set of points that satisfy the inequality. If the region is shaded on one side of a boundary line, it means that all points in that region are solutions to the inequality.
Outlines

هذا القسم متوفر فقط للمشتركين. يرجى الترقية للوصول إلى هذه الميزة.
قم بالترقية الآنMindmap

هذا القسم متوفر فقط للمشتركين. يرجى الترقية للوصول إلى هذه الميزة.
قم بالترقية الآنKeywords

هذا القسم متوفر فقط للمشتركين. يرجى الترقية للوصول إلى هذه الميزة.
قم بالترقية الآنHighlights

هذا القسم متوفر فقط للمشتركين. يرجى الترقية للوصول إلى هذه الميزة.
قم بالترقية الآنTranscripts

هذا القسم متوفر فقط للمشتركين. يرجى الترقية للوصول إلى هذه الميزة.
قم بالترقية الآنتصفح المزيد من مقاطع الفيديو ذات الصلة
PERTIDAKSAMAAN LINEAR DUA VARIABEL

Materi Sistem pertidaksamaan Linear dua Variabel (Matematika) - Bagian 1
cara cepat sistem pertidaksamaan linier dua variabel dari grafik
SPtDV Matematika Kelas 10 • Part 6: Contoh Soal Sistem Pertidaksamaan Linear Dua Variabel / SPtLDV
Menyelesaikan Permasalahan Program Linear Menentukan Nilai Optimum dengan Metode Uji Titik Pojok
Materi:Himpunan Penyelesaian Sistem Pertidaksamaan Linear (Dua) Variabel" (SPTLDV) Kelompok-1
5.0 / 5 (0 votes)
