DEADLINE 5 : PROGRAM MODULAR for Algorithm and Programming Practicum 2024/2025
Summary
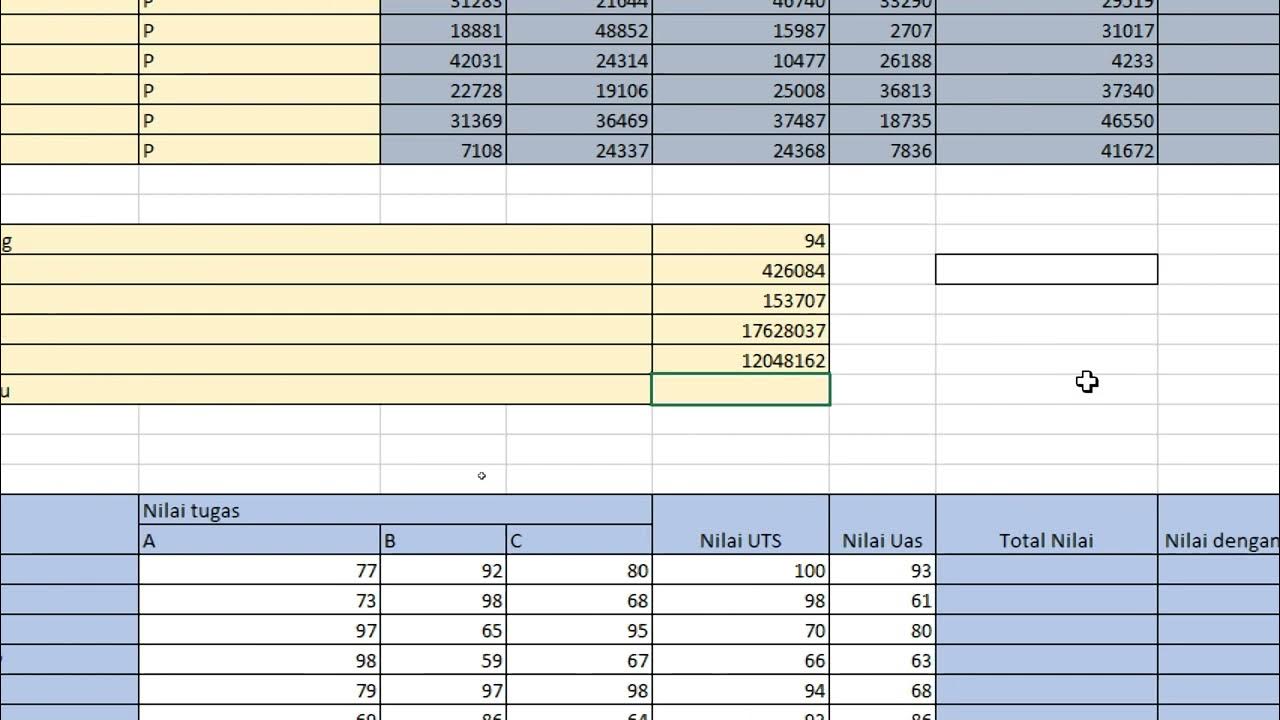
TLDRThis tutorial guides users through a practical session on salary distribution at PT Alpha Duro, focusing on calculating total salaries using parameters like position, department, years of service, and working days. The session covers importing essential libraries (pandas, matplotlib, numpy), creating functions for data processing, and visualizing the salary distribution. It also includes exporting the results to Excel for further analysis. The goal is to automate salary calculations, compare them with the company’s budget, and display the findings graphically for clearer insights.
Takeaways
- 😀 The tutorial focuses on creating a Python program to calculate and compare employee salaries against a company's budget based on several parameters.
- 😀 The key parameters for salary calculation include position, department, years of service, and working days.
- 😀 The program uses libraries like Pandas for data manipulation, Matplotlib for data visualization, and Numpy for calculations.
- 😀 The process involves importing data from Excel and generating a DataFrame for easier handling and analysis.
- 😀 The program compares salary distributions with the budget allocated per division (IT, HR, Finance, Marketing) through a bar chart.
- 😀 Functions in the program include creating a DataFrame, visualizing data, saving results to Excel, and importing data from Excel.
- 😀 The program allows for error handling to manage incorrect input data or issues during data import.
- 😀 A key feature of the program is saving the results into an Excel file with sheets for employee data, average salary by position, and average salary per division.
- 😀 The bar chart generated compares total salary usage against the budget for each division, providing a clear visual representation.
- 😀 The program demonstrates sorting and calculating average salaries for different positions and divisions, providing insights for salary distribution.
- 😀 The output Excel file (`employee_salary_report.xlsx`) serves as a detailed report with three sheets, including data for employee salaries, position-based averages, and division-based averages.
Q & A
What is the main objective of the tutorial in this script?
-The main objective of the tutorial is to teach how to calculate and visualize employee salary distribution at PT Alpha Duro, based on parameters such as position, department, years of service, and working days. It also includes comparing total salary costs with the company's budget for each department.
Which libraries are being used in the script, and what are their purposes?
-The script uses the following libraries: `pandas` for handling and processing data, `numpy` for performing numerical calculations, and `matplotlib` (along with `matplotlib.ticker`) for visualizing the data and creating a bar chart comparison between the salary used and the budget.
How is the salary of each employee calculated in the program?
-The salary is calculated based on several parameters: position, department, years of service, and working days. These parameters are input by the user, and the program processes them to compute each employee's total salary.
What is the purpose of the `create_data_frame` function?
-The `create_data_frame` function is responsible for converting the employee data into a Pandas DataFrame, which will then be used for further calculations and visualizations.
What is the role of the `visualize_data` function in the program?
-The `visualize_data` function generates a bar chart that compares the total salary used for each division with the respective division budget. It helps to visually analyze the differences between the calculated salary expenses and the allocated budget for each division.
How does the program handle data output and storage?
-The program outputs the processed employee data, salary calculations, and average salaries to an Excel file. It creates multiple sheets in the file, such as one for employee data, one for average salary per position, and one for average salary per division.
What steps are involved in saving the data to Excel?
-The data is saved by first creating an Excel writer object using `pd.ExcelWriter`. The processed DataFrame is written to the file, and different sheets are added for employee data, average salary per position, and average salary per division. The program then confirms successful saving of the data.
What does the `input_data_from_excel` function do?
-The `input_data_from_excel` function reads employee data from an Excel file, processes it by calculating the salaries, and then adds this data into the system for further processing or reporting.
What error handling is included in the program?
-The program includes error handling in functions like `validate_input` to check the correctness of inputs, and `input_data_from_excel` to manage issues that arise when loading and processing the Excel file. Exceptions are caught, and meaningful error messages are displayed to the user.
What is the significance of the graphical comparison between salary and budget?
-The graphical comparison allows the user to visually assess how well each department's salary spending aligns with its allocated budget. This visual analysis helps the company track whether any departments are over or under-spending compared to their budget.
Outlines

هذا القسم متوفر فقط للمشتركين. يرجى الترقية للوصول إلى هذه الميزة.
قم بالترقية الآنMindmap

هذا القسم متوفر فقط للمشتركين. يرجى الترقية للوصول إلى هذه الميزة.
قم بالترقية الآنKeywords

هذا القسم متوفر فقط للمشتركين. يرجى الترقية للوصول إلى هذه الميزة.
قم بالترقية الآنHighlights

هذا القسم متوفر فقط للمشتركين. يرجى الترقية للوصول إلى هذه الميزة.
قم بالترقية الآنTranscripts

هذا القسم متوفر فقط للمشتركين. يرجى الترقية للوصول إلى هذه الميزة.
قم بالترقية الآنتصفح المزيد من مقاطع الفيديو ذات الصلة


5.0 / 5 (0 votes)
