Relasi dan Fungsi Matematika Kelas 10 • Part 22: Fungsi Rasional Bentuk 1 - Linear / Linear
Summary
TLDRIn this video, the presenter introduces the concept of rational functions, specifically focusing on the form FX = (AX + B) / (PX + Q). The tutorial explains the properties of the numerator and denominator, including how the numerator can be linear or constant (but not zero) and the denominator must be linear. The video also covers how to draw the graph of such functions, focusing on vertical and horizontal asymptotes, and how to find the intercepts with the coordinate axes. Finally, the presenter discusses the process of dividing functions and finding critical points on the graph for a better understanding.
Takeaways
- 😀 The video discusses rational functions, specifically focusing on the first form: FX = (AX + B) / (PX + Q).
- 😀 The numerator of this rational function can be either a linear or constant function, but the constant function cannot be zero.
- 😀 The denominator must be a linear function, where the coefficient of x (P) must not equal zero, as this would make it a constant function.
- 😀 The graph of this rational function is an orthogonal hyperbola, which will be explained in more detail with an example.
- 😀 The first step in graphing a rational function is to find the vertical and horizontal asymptotes.
- 😀 To find the vertical asymptote, set the denominator equal to zero (PX + Q = 0) and solve for x.
- 😀 The horizontal asymptote can be found by dividing the coefficient of x in the numerator by the coefficient of x in the denominator.
- 😀 An example of dividing the rational function (3x - 1) / (x + 2) demonstrates the process of finding horizontal asymptotes and remainders.
- 😀 After finding the asymptotes, the next step is to determine the curve’s intersection points with the x-axis and y-axis.
- 😀 The video also emphasizes determining the regions where the curve is above or below the x-axis by performing sign tests and finding critical points, such as intercepts and asymptotes.
Q & A
What is the main topic of the video?
-The main topic of the video is rational functions, specifically focusing on the rational function of the form FX = (AX + B) / (PX + Q).
What is a rational function in this context?
-A rational function in this context refers to a function where the numerator is a linear or constant function (AX + B), and the denominator is a linear function (PX + Q). The coefficients must be such that the denominator is not zero.
What kind of asymptotes does this rational function have?
-The rational function has two types of asymptotes: a vertical asymptote and a horizontal asymptote. There are no oblique asymptotes for this function.
How do you find the vertical asymptote for this rational function?
-To find the vertical asymptote, set the denominator (PX + Q) equal to zero and solve for X. This will give you the value of X where the vertical asymptote occurs.
How do you find the horizontal asymptote for this rational function?
-To find the horizontal asymptote, divide the coefficients of the highest degree terms in the numerator and the denominator. The horizontal asymptote is given by the ratio of these coefficients.
What is the principle behind determining the vertical asymptote?
-The principle behind determining the vertical asymptote is that the denominator must be equal to zero, and solving this equation provides the location of the vertical asymptote.
How do you calculate the result of dividing two functions?
-To divide two functions, divide the highest degree term of the numerator by the highest degree term of the denominator. This gives the quotient. For the remainder, apply polynomial long division if needed.
What is the importance of finding the intersection points with the coordinate axes?
-Finding the intersection points with the coordinate axes helps in understanding the behavior of the graph. The intersection with the x-axis (y=0) and the y-axis (x=0) provides key points for sketching the graph.
What is the significance of determining the regions of the graph?
-Determining the regions of the graph helps identify where the curve is above or below the x-axis, and which areas correspond to positive or negative values. This is essential for drawing an accurate graph.
Why are auxiliary points needed in graphing a rational function?
-Auxiliary points are needed because they provide additional reference points for sketching the curve. The more auxiliary points you have, the more accurate the graph will be. However, they require more calculations.
Outlines

هذا القسم متوفر فقط للمشتركين. يرجى الترقية للوصول إلى هذه الميزة.
قم بالترقية الآنMindmap

هذا القسم متوفر فقط للمشتركين. يرجى الترقية للوصول إلى هذه الميزة.
قم بالترقية الآنKeywords

هذا القسم متوفر فقط للمشتركين. يرجى الترقية للوصول إلى هذه الميزة.
قم بالترقية الآنHighlights

هذا القسم متوفر فقط للمشتركين. يرجى الترقية للوصول إلى هذه الميزة.
قم بالترقية الآنTranscripts

هذا القسم متوفر فقط للمشتركين. يرجى الترقية للوصول إلى هذه الميزة.
قم بالترقية الآنتصفح المزيد من مقاطع الفيديو ذات الصلة
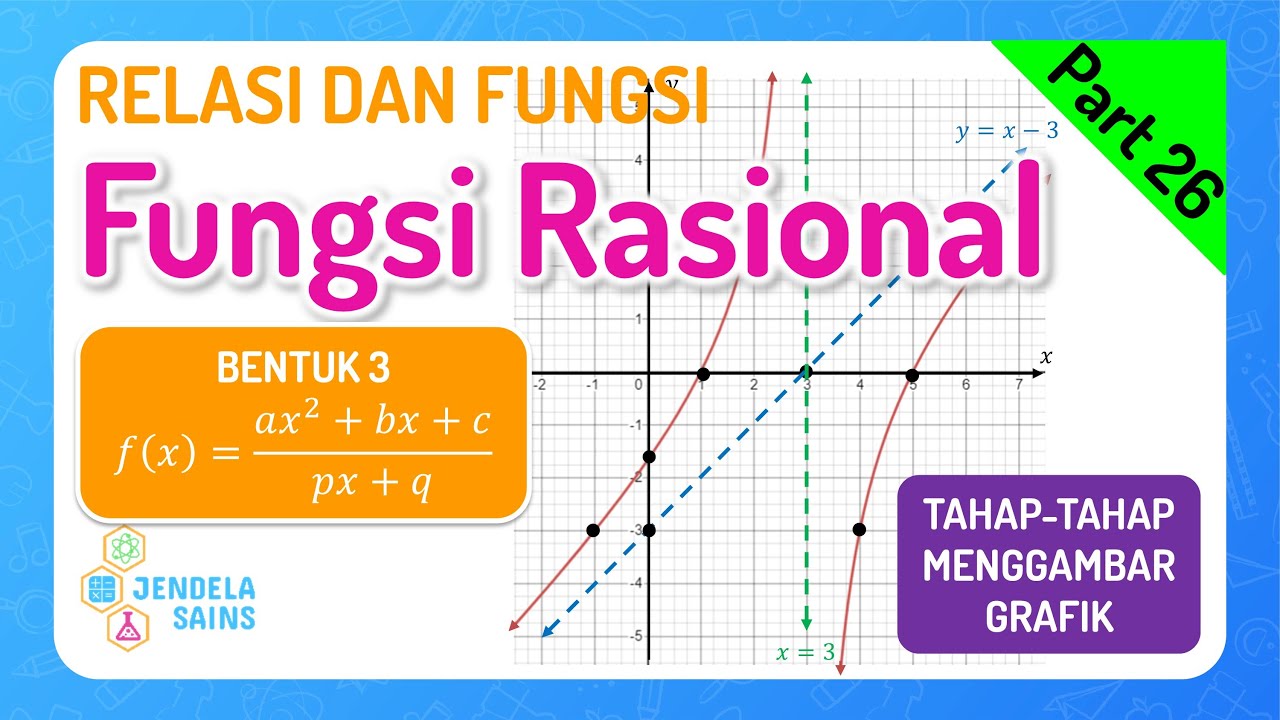
Relasi dan Fungsi Matematika Kelas 10 • Part 26: Fungsi Rasional Bentuk 3 - Kuadrat / Linear
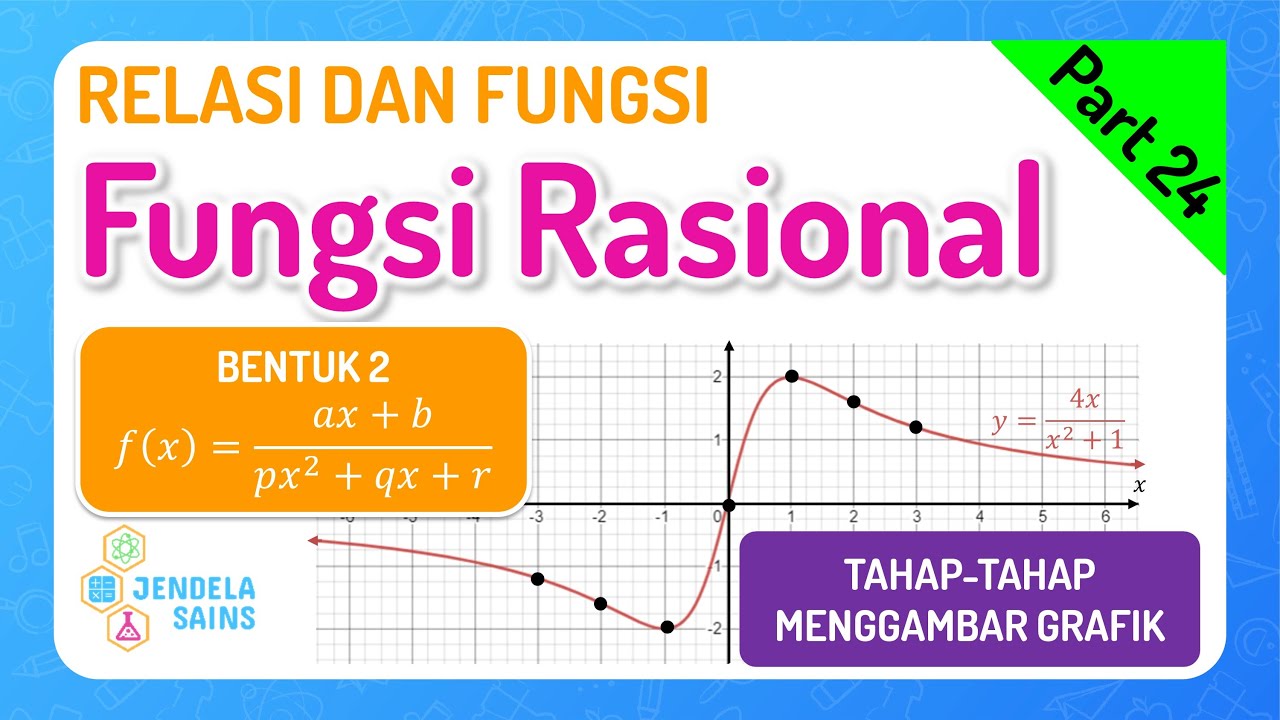
Relasi dan Fungsi Matematika Kelas 10 • Part 24: Fungsi Rasional Bentuk 2 - Linear / Kuadrat

Relasi dan Fungsi Matematika Kelas 10 • Part 27: Soal Fungsi Rasional Bentuk 3 - Kuadrat / Linear
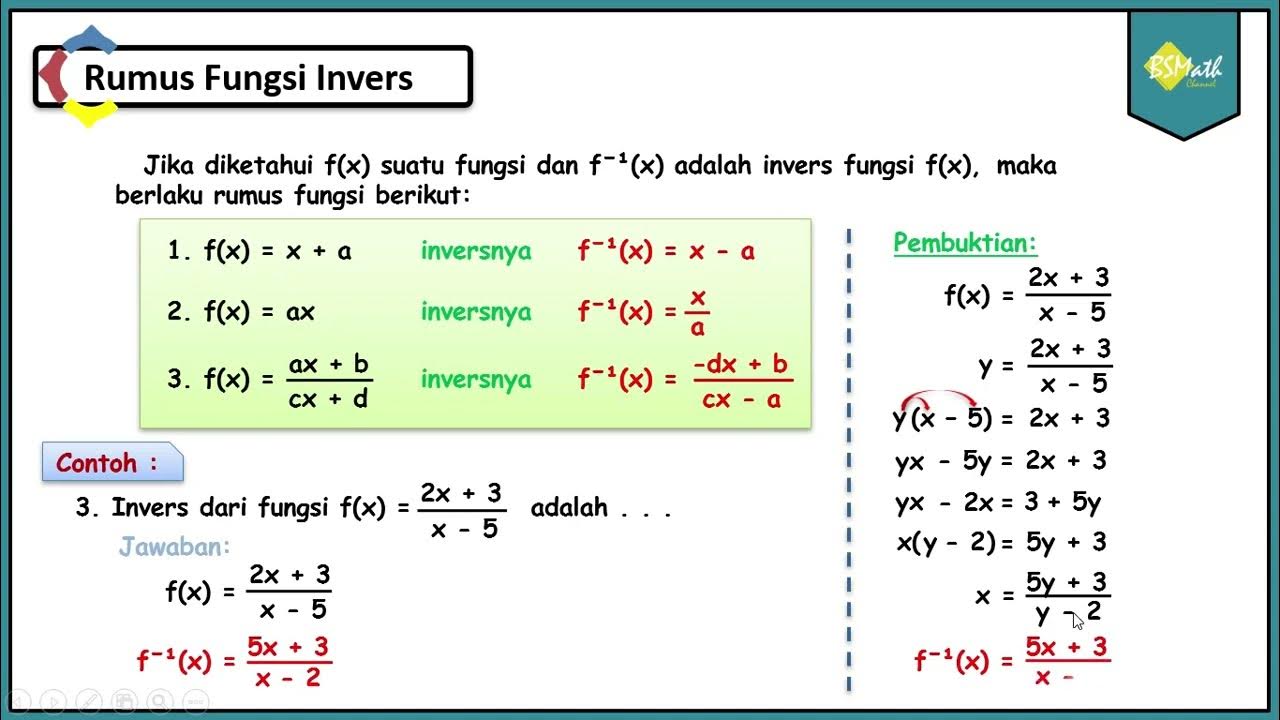
Rumus Fungsi Invers - Matematika SMA Kelas XI Kurikulum Merdeka

ESTUDO DAS FUNÇÕES: FUNÇÃO AFIM - PARTE I ( AULA 3 DE 9 ) | MATEMÁTICA INTEGRAL

Menggambar Grafik Fungsi Rasional #fazanugas
5.0 / 5 (0 votes)
