Distribusi Probabilitas Normal
Summary
TLDRIn this video, Yudistira Ardhana explains the concept of normal probability distribution, focusing on key characteristics such as symmetry, the bell-shaped curve, and asymptotic behavior. He demonstrates how to calculate Z-scores and use standard normal distribution tables for analysis. The video includes practical examples like stock prices and fruit weights, guiding viewers through the transformation of raw data into Z-scores and interpreting results. The material is aimed at students learning statistics, with an emphasis on understanding how to work with normal distribution calculations and applying them to real-life scenarios.
Takeaways
- 😀 The normal probability distribution curve is bell-shaped, symmetric around the mean, and has two equal halves, each representing 50% of the total probability.
- 😀 The curve is asymptotic, meaning it never touches the horizontal axis.
- 😀 The peak of the normal distribution curve occurs at the mean, median, and mode, all of which are equal in a perfectly normal distribution.
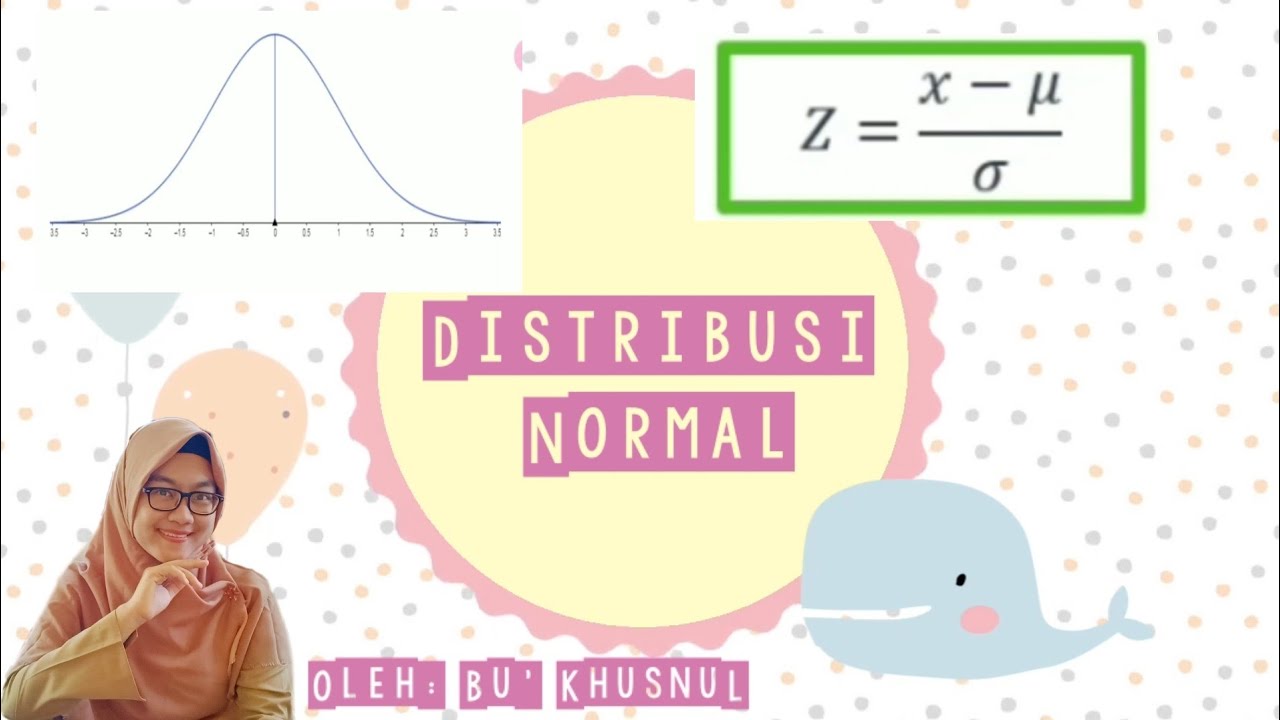
- 😀 The Z-score formula is: Z = (X - μ) / σ, where X is the value in question, μ is the mean, and σ is the standard deviation.
- 😀 A Z-score represents the number of standard deviations a data point is away from the mean, helping to standardize data for easier comparison.
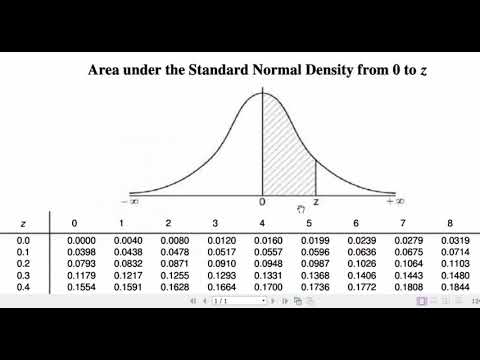
- 😀 To transform raw data into a standard normal distribution, you calculate the Z-score and refer to the Z-table for probabilities.
- 😀 A Z-score of 0 corresponds to the mean of the distribution, and negative Z-scores indicate values below the mean, while positive Z-scores are above the mean.
- 😀 In a stock price example, a mean of 4907 and a standard deviation of 1447 gives a Z-score of 0.76 for a stock price of 600.
- 😀 For durian weight, with a mean of 5 kg and a standard deviation of 1.5 kg, the Z-scores for 8.5 kg and 2.5 kg are 2.33 and -1.67, respectively.
- 😀 When calculating probabilities for values below the mean (e.g., less than 250 grams for a mangga), you subtract the Z-table value from 0.5 to find the cumulative probability.
- 😀 The Z-score allows you to find probabilities for real-world scenarios, such as the probability of 20 returns at a store, where a Z-score of 2.5 results in a 0.62% chance of the event occurring.
Q & A
What is the main topic of the video?
-The main topic of the video is explaining the concept of normal probability distribution, including its characteristics, and how to calculate and interpret Z-scores using the normal distribution table.
What is a normal probability distribution?
-A normal probability distribution is a continuous probability distribution that is symmetric about the mean, meaning the left and right sides are mirror images. It follows a bell-shaped curve.
What are the key characteristics of a normal probability distribution?
-The key characteristics include: 1) A bell-shaped curve, 2) Symmetry about the mean, 3) The curve is asymptotic, meaning it approaches but never touches the horizontal axis, and 4) The peak of the curve occurs at the mean, which is also equal to the median and mode.
What does the formula for calculating the Z-score represent?
-The Z-score formula, Z = (X - μ) / σ, represents how many standard deviations a specific value (X) is away from the mean (μ). Here, X is the data point, μ is the mean, and σ is the standard deviation.
What is the significance of a Z-score in normal distribution?
-A Z-score indicates how far and in which direction a data point deviates from the mean of a normal distribution. It allows for comparing values from different normal distributions.
How do you convert a Z-score into a probability using the Z-table?
-To convert a Z-score into a probability, you look up the Z-score in the standard normal distribution table (Z-table). The value corresponds to the area under the curve to the left of that Z-score, representing the probability of a value being less than or equal to the given point.
How do you calculate the Z-score for a stock price of 600, given the mean is 490.7 and the standard deviation is 144.7?
-To calculate the Z-score, use the formula Z = (X - μ) / σ. Substituting the values: Z = (600 - 490.7) / 144.7 = 0.76.
What does a negative Z-score indicate?
-A negative Z-score indicates that the data point is below the mean of the distribution. It shows that the value lies to the left of the mean on the normal distribution curve.
In the context of a durian's weight, how would you calculate the Z-scores for 8.5 kg and 2.5 kg given the mean weight is 5 kg and the standard deviation is 1.5 kg?
-For 8.5 kg, Z = (8.5 - 5) / 1.5 = 2.33. For 2.5 kg, Z = (2.5 - 5) / 1.5 = -1.67.
How do you interpret the probability when it’s said that the probability of a mango weighing less than 250 grams is less than a certain value?
-The probability corresponds to the area under the normal distribution curve to the left of the Z-score, which represents the chance that a mango will weigh less than 250 grams. In this case, the Z-score for 250 grams is -2, and the probability is the area to the left of this Z-score.
Outlines

هذا القسم متوفر فقط للمشتركين. يرجى الترقية للوصول إلى هذه الميزة.
قم بالترقية الآنMindmap

هذا القسم متوفر فقط للمشتركين. يرجى الترقية للوصول إلى هذه الميزة.
قم بالترقية الآنKeywords

هذا القسم متوفر فقط للمشتركين. يرجى الترقية للوصول إلى هذه الميزة.
قم بالترقية الآنHighlights

هذا القسم متوفر فقط للمشتركين. يرجى الترقية للوصول إلى هذه الميزة.
قم بالترقية الآنTranscripts

هذا القسم متوفر فقط للمشتركين. يرجى الترقية للوصول إلى هذه الميزة.
قم بالترقية الآنتصفح المزيد من مقاطع الفيديو ذات الصلة

Apa itu Kurva Normal?

Metode Statistika | Sebaran Peluang Kontinu | Mengenal Sebaran Normal

Distribusi Normal Bagian 1 Matematika Minat Kelas XII Semester 2
Peluang Distribusi NORMAL beserta Contoh Soal Pembahasan

FRM: Normal probability distribution
Distribusi Normal | Konsep Dasar dan Sifat Kurva Normal | Matematika Peminatan Kelas 12
5.0 / 5 (0 votes)
