Statistika Bagian 4 - Median dan Kuartil Data Tunggal dan Data Kelompok Matematika Wajib Kelas 12
Summary
TLDRIn this video, Dedy Handayani explains how to calculate the median and quartiles (Q1, Q2, Q3) for both individual and grouped data. Starting with an introduction to median and quartiles, the video highlights the importance of ordering data from smallest to largest before identifying the median as the middle value, and quartiles as values dividing data into four equal parts. The video provides step-by-step examples and formulas for calculating quartiles in grouped data and demonstrates practical applications using various datasets, making it easy for viewers to understand these statistical concepts.
Takeaways
- 😀 The video discusses how to find the median and quartiles for both ungrouped and grouped data.
- 😀 The median divides data into two equal parts and is located at the center after sorting the data.
- 😀 Quartiles divide data into four equal parts, with Q1 representing the lower quartile, Q2 being the median, and Q3 the upper quartile.
- 😀 Sorting the data is crucial before calculating median and quartiles.
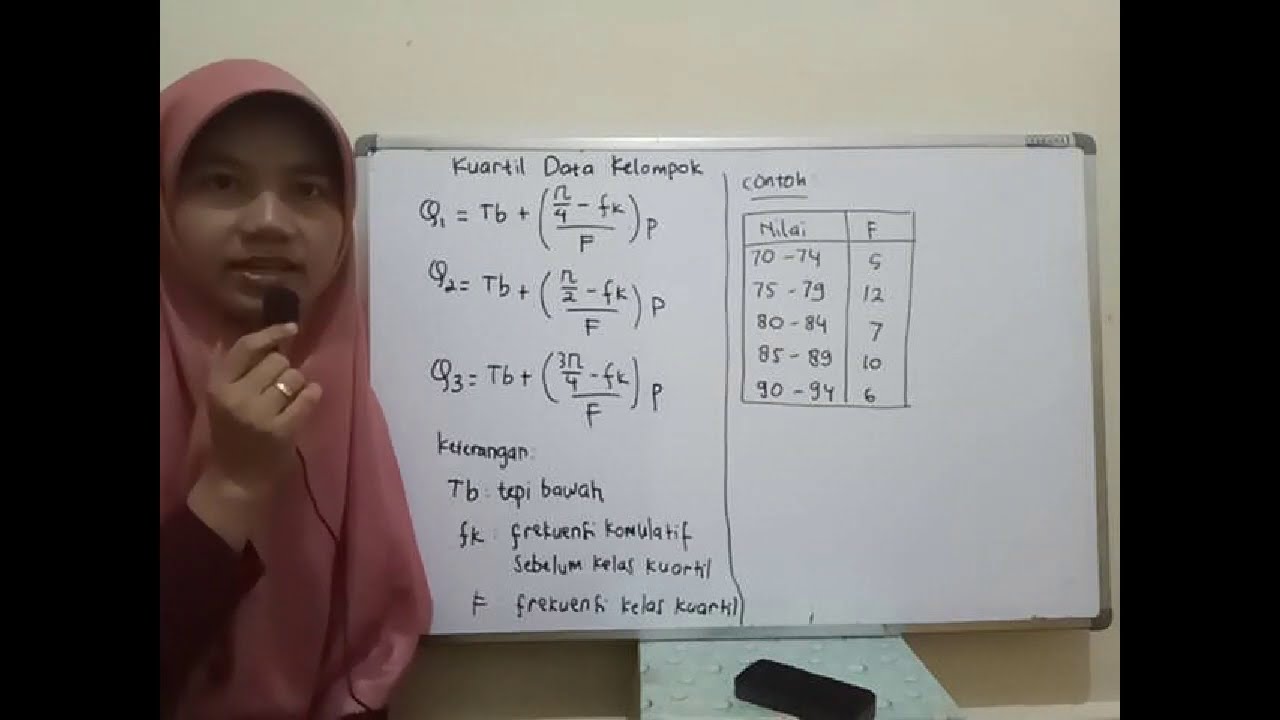
- 😀 The formula for finding quartiles involves using specific values like the cumulative frequency, lower class boundary, and class width.
- 😀 In ungrouped data, the median is the middle value when data is sorted, while Q1 and Q3 are the medians of the lower and upper halves of the data.
- 😀 For grouped data, the formula for quartiles requires calculating cumulative frequencies and applying the quartile formula.
- 😀 The importance of distinguishing between Q1 (lower quartile), Q2 (median), and Q3 (upper quartile) is emphasized.
- 😀 Median for grouped data can be determined using the formula by substituting the values for Q2, and similarly for Q1 and Q3.
- 😀 The process of finding quartiles in histograms follows the same principle as grouped data, where the median is calculated by applying a specific formula.
Q & A
What is the median in statistics?
-The median is the middle value that divides a dataset into two equal halves. To find the median, the data must first be sorted in ascending order. It is the value that falls exactly in the middle of the dataset.
How do you calculate the median for a dataset?
-To calculate the median, first arrange the data in ascending order. If the number of data points is odd, the median is the value in the center. If the number of data points is even, the median is the average of the two middle values.
What is a quartile in statistics?
-A quartile divides a dataset into four equal parts, each containing 25% of the data. The three main quartiles are: Q1 (lower quartile), Q2 (median), and Q3 (upper quartile).
What is the difference between median and quartile?
-The median (Q2) is the middle value that divides the dataset into two equal parts. Quartiles, on the other hand, divide the dataset into four equal parts: Q1 (lower quartile), Q2 (median), and Q3 (upper quartile).
How do you find Q1 (lower quartile)?
-To find Q1, divide the data into two halves. The lower half consists of the data points before the median. The median of this lower half is Q1.
How do you find Q3 (upper quartile)?
-To find Q3, divide the data into two halves. The upper half consists of the data points after the median. The median of this upper half is Q3.
What is the formula to calculate quartiles in grouped data?
-For grouped data, quartiles can be calculated using the formula: Q = L + [(N/4 - F) / f] * w, where L is the lower boundary of the quartile class, N is the total number of data points, F is the cumulative frequency before the quartile class, f is the frequency of the quartile class, and w is the class width.
What does the cumulative frequency represent in grouped data?
-Cumulative frequency represents the sum of the frequencies for all classes up to and including a given class. It helps identify the position of a particular data point in a grouped dataset.
How do you determine the class for a specific quartile in grouped data?
-To determine the class for a specific quartile in grouped data, first calculate the position of the quartile (e.g., Q1, Q2, or Q3) by finding the cumulative frequency. The quartile class is the class where this cumulative frequency lies.
What is the process for finding the median of a histogram?
-To find the median from a histogram, calculate the total frequency (n), then find the class where the cumulative frequency equals half of n. The formula for the median in a histogram is the same as for grouped data, using the boundaries, frequencies, and class width.
Outlines

هذا القسم متوفر فقط للمشتركين. يرجى الترقية للوصول إلى هذه الميزة.
قم بالترقية الآنMindmap

هذا القسم متوفر فقط للمشتركين. يرجى الترقية للوصول إلى هذه الميزة.
قم بالترقية الآنKeywords

هذا القسم متوفر فقط للمشتركين. يرجى الترقية للوصول إلى هذه الميزة.
قم بالترقية الآنHighlights

هذا القسم متوفر فقط للمشتركين. يرجى الترقية للوصول إلى هذه الميزة.
قم بالترقية الآنTranscripts

هذا القسم متوفر فقط للمشتركين. يرجى الترقية للوصول إلى هذه الميزة.
قم بالترقية الآنتصفح المزيد من مقاطع الفيديو ذات الصلة

Cara Menghitung Kuartil Data Tunggal dan Data Kelompok #STATISTIKA

Quartil (Data Tunggal dan Kelompok)

STATISTIKA Part 2- Jangkauan, Kuartil dan Jangkauan interkuartil
KUARTIL DATA KELOMPOK

Cara mudah menentukan nilai kuartil data kelompok - Q1, Q2 dan Q3

Kuartil Data Tunggal dan Berkelompok, matematika kelas 12
5.0 / 5 (0 votes)
