Step-by-step Seemingly Unrelated Regression estimation (part 1 - in excel)
Summary
TLDRIn this video, the presenter introduces a series focused on seemingly unrelated regression and the implementation of sure estimation in Excel. The session guides viewers step-by-step through complex matrix calculations, covering essential concepts such as OLS estimation and creating matrices for dependent and independent variables. By breaking down the process into 11 clear steps, the video aims to demystify the procedures and provide practical skills for performing sure estimation, ultimately preparing students for further applications in statistical software like Stata, SAS, and SPSS.
Takeaways
- 😀 Sure Estimation and Seemingly Unrelated Regression (SUR) will be covered in a series of videos, starting with Excel.
- 😀 The first video focuses on using Excel to calculate results, as many students find the underlying concepts confusing.
- 😀 Key matrices in Sure Estimation include the dependent variable (Y), independent variables (X), and the covariance matrix (W).
- 😀 The X matrix size is determined by the number of parameters estimated from the equations involved.
- 😀 If there is no contemporaneous covariance, the beta estimator reduces to Ordinary Least Squares (OLS) results.
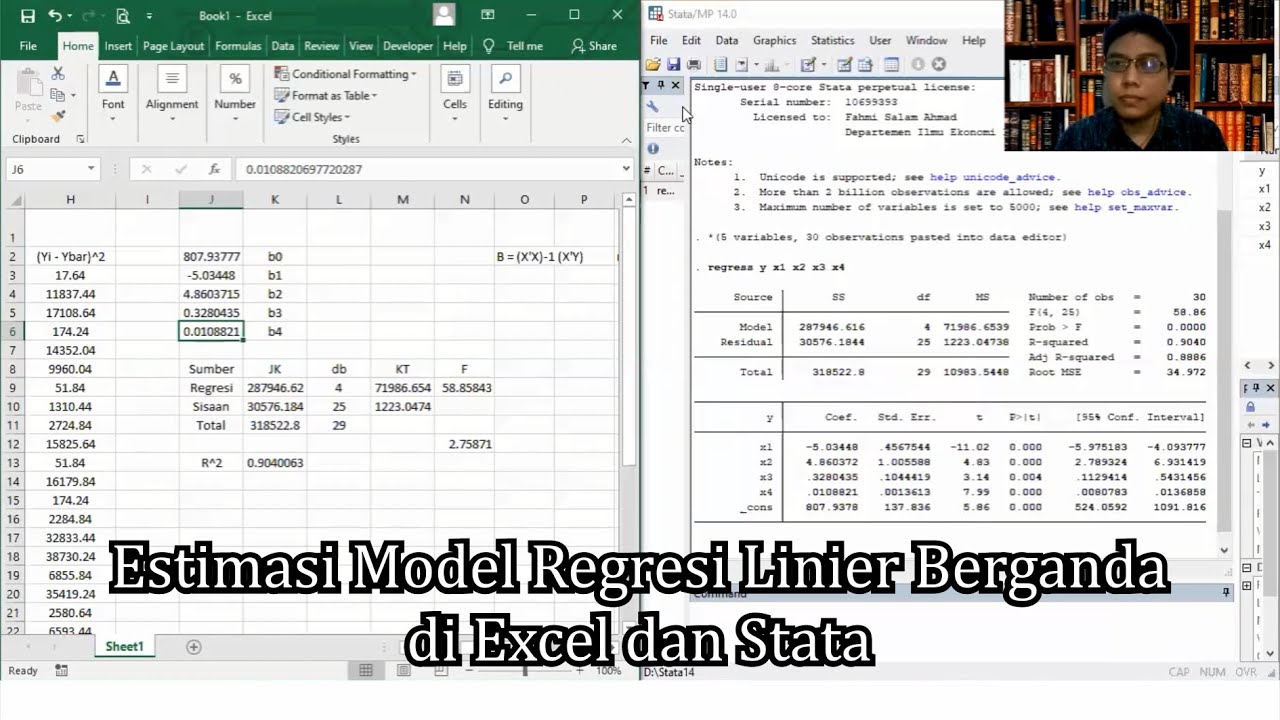
- 😀 The estimation process in Excel involves using functions like `LINEST` for OLS results and `TRANSPOSE` for matrix manipulation.
- 😀 Variance and covariance matrices are essential for accurate estimation and are derived from the residuals of OLS regression.
- 😀 Matrix operations such as multiplication (`MMULT`) and inversion (`MINVERSE`) are crucial for obtaining final estimates.
- 😀 Results from Sure Estimation differ from OLS results when contemporaneous covariance is present.
- 😀 Viewers are encouraged to replicate results and prepare for upcoming videos that will explore similar concepts in Stata, SAS, and SPSS.
Q & A
What is the main focus of the video series?
-The series focuses on sure estimation and seemingly unrelated regression, with the first video dedicated to performing calculations in Excel.
Why do students often get confused with sure estimation?
-Students often find it confusing due to the complex definitions of matrices and calculations involved in estimating relationships between variables.
What is the initial step in the sure estimation process as described in the video?
-The initial step is to estimate ordinary least squares (OLS) results and obtain residuals from the dependent variables.
How do you define the Y and X matrices in the analysis?
-The Y matrix is defined by stacking the observations of the dependent variables, while the X matrix is created by stacking the independent variables alongside a column of ones for the constant term.
What does the W matrix represent in the sure estimation process?
-The W matrix represents the variances and covariances estimated from the residuals of the OLS regression, which is crucial for the sure estimation calculations.
What role does contemporaneous covariance play in the results?
-Contemporaneous covariance affects the beta estimator; if present, it alters the results compared to OLS estimates, while absence means the OLS and sure estimation results will align.
What command is used in Excel to perform OLS regression?
-The command used is 'LIMLS,' which stands for linear estimation, allowing for the calculation of coefficients and residuals.
How can users navigate through the Excel sheet during analysis?
-The Excel sheet includes hyperlinks that allow users to jump between different steps of the analysis easily.
What are the final results compared in the video?
-The final results compare the OLS outcomes with the sure estimation results, highlighting differences due to the methodologies used.
What is the next step after completing this video?
-Viewers are encouraged to practice with the provided worksheet and prepare for the next video, which will demonstrate similar estimations using Stata, SAS, and SPSS.
Outlines

هذا القسم متوفر فقط للمشتركين. يرجى الترقية للوصول إلى هذه الميزة.
قم بالترقية الآنMindmap

هذا القسم متوفر فقط للمشتركين. يرجى الترقية للوصول إلى هذه الميزة.
قم بالترقية الآنKeywords

هذا القسم متوفر فقط للمشتركين. يرجى الترقية للوصول إلى هذه الميزة.
قم بالترقية الآنHighlights

هذا القسم متوفر فقط للمشتركين. يرجى الترقية للوصول إلى هذه الميزة.
قم بالترقية الآنTranscripts

هذا القسم متوفر فقط للمشتركين. يرجى الترقية للوصول إلى هذه الميزة.
قم بالترقية الآنتصفح المزيد من مقاطع الفيديو ذات الصلة


5.0 / 5 (0 votes)
