STATISTIKA | CONTOH SOAL ESTIMASI SATU VARIANSI
Summary
TLDRIn this video, the presenter discusses how to estimate variance using two practical examples. The first example involves a random sample of cement bags to determine a 95% confidence interval for the population variance and standard deviation. The second example explores the lifespan of a specific type of light bulb, calculating a 99% confidence interval for its variance. The video emphasizes the importance of using the chi-square distribution table for these calculations and concludes with clear results for each case, making it a useful resource for understanding statistical estimation.
Takeaways
- 😀 Understanding the estimation of variance is essential in statistics, particularly for analyzing sample data.
- 📊 Sample size (n) and sample variance (s²) are critical components in calculating confidence intervals for population variance.
- 📈 The chi-square distribution is used to estimate the population variance based on sample data.
- 🧮 Confidence levels (such as 95% or 99%) determine the significance level (α) used in statistical calculations.
- 🔍 The chi-square critical values are found using specific significance levels (α/2 and 1 - α/2) based on the degrees of freedom (df).
- 📝 In Example 1, a sample size of 10 with a standard deviation of 0.3 kg results in a variance confidence interval of (0.043, 0.3).
- 🕒 In Example 2, for a sample size of 8 with a standard deviation of 1.5 hours, the 99% confidence interval for variance is (0.776, 15.925).
- 💡 The formula for calculating confidence intervals for variance includes substituting sample values and chi-square critical values.
- 📉 Variance and standard deviation are crucial for understanding the dispersion of data within a sample or population.
- 🎥 The video serves as a practical guide for students learning about statistical methods for variance estimation.
Q & A
What is the primary focus of the video?
-The video discusses examples of estimating variance, including formulas and calculations for confidence intervals.
What formula is used to estimate variance?
-The formula includes the sample size (n), sample variance (x²), and the population variance (σ²) using the chi-square distribution.
How is the confidence interval for variance determined?
-The confidence interval is determined by calculating the lower and upper bounds using chi-square values based on the given alpha level.
What is the sample size and standard deviation mentioned in the first example?
-In the first example, the sample size is 10 and the standard deviation is 0.3 kg.
How is the chi-square value for alpha = 0.025 derived?
-The chi-square value for alpha = 0.025 is found using a chi-square table, which corresponds to the degrees of freedom and the desired alpha level.
What are the final results for the estimated variance in the first example?
-The estimated variance has a lower bound of 0.0425 and an upper bound of 0.3.
What is the sample size and standard deviation in the second example?
-In the second example, the sample size is 8 and the standard deviation is 1.5 hours.
What confidence level is used in the second example?
-The second example uses a confidence level of 99%.
How are the chi-square values for the second example obtained?
-The chi-square values are obtained from the chi-square table, calculated for alpha values of 0.005 and 0.995 based on the degrees of freedom.
What are the final results for the estimated variance in the second example?
-The estimated variance has a lower bound of 0.776 and an upper bound of 15.925.
Outlines

هذا القسم متوفر فقط للمشتركين. يرجى الترقية للوصول إلى هذه الميزة.
قم بالترقية الآنMindmap

هذا القسم متوفر فقط للمشتركين. يرجى الترقية للوصول إلى هذه الميزة.
قم بالترقية الآنKeywords

هذا القسم متوفر فقط للمشتركين. يرجى الترقية للوصول إلى هذه الميزة.
قم بالترقية الآنHighlights

هذا القسم متوفر فقط للمشتركين. يرجى الترقية للوصول إلى هذه الميزة.
قم بالترقية الآنTranscripts

هذا القسم متوفر فقط للمشتركين. يرجى الترقية للوصول إلى هذه الميزة.
قم بالترقية الآنتصفح المزيد من مقاطع الفيديو ذات الصلة

The nature of heritability

Menentukan pH Larutan Berdasarkan Pengujian dengan Indikator Asam Basa

Basic DOE Analysis Example in Minitab

Konsep Earned Value Management dalam 10 Menit
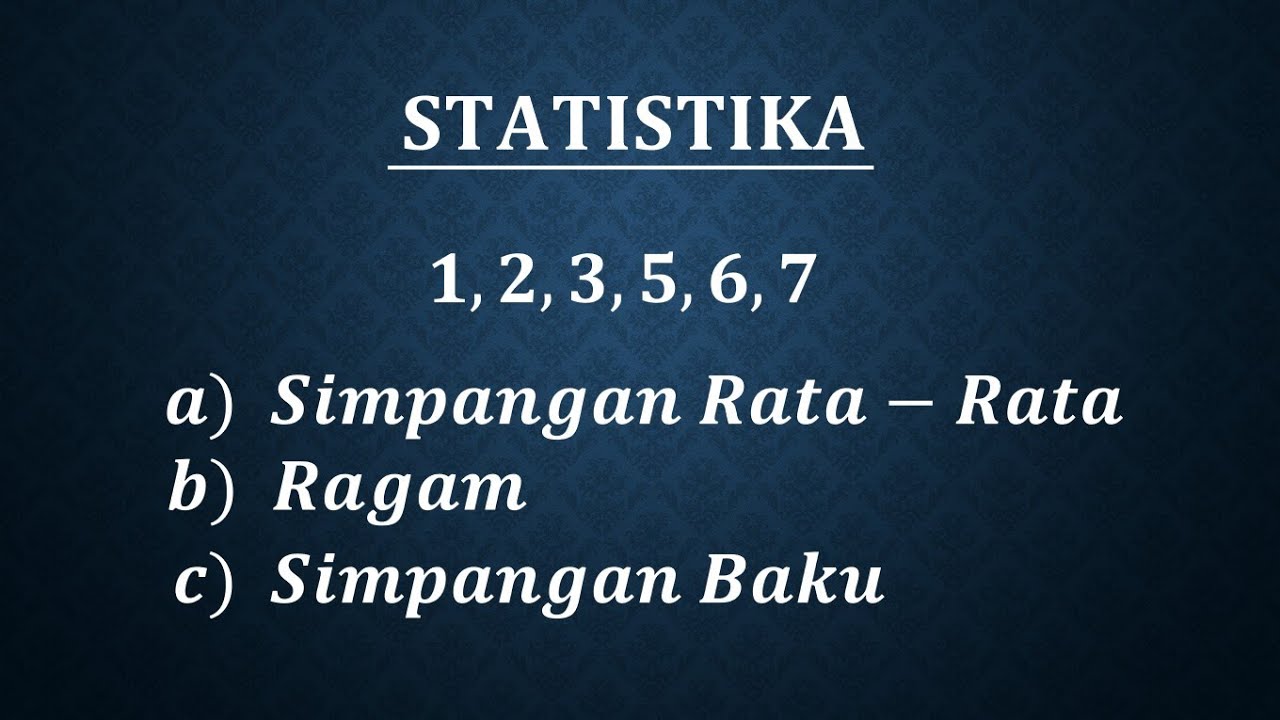
Simpangan rata-rata, ragam dan simpangan baku data tunggal
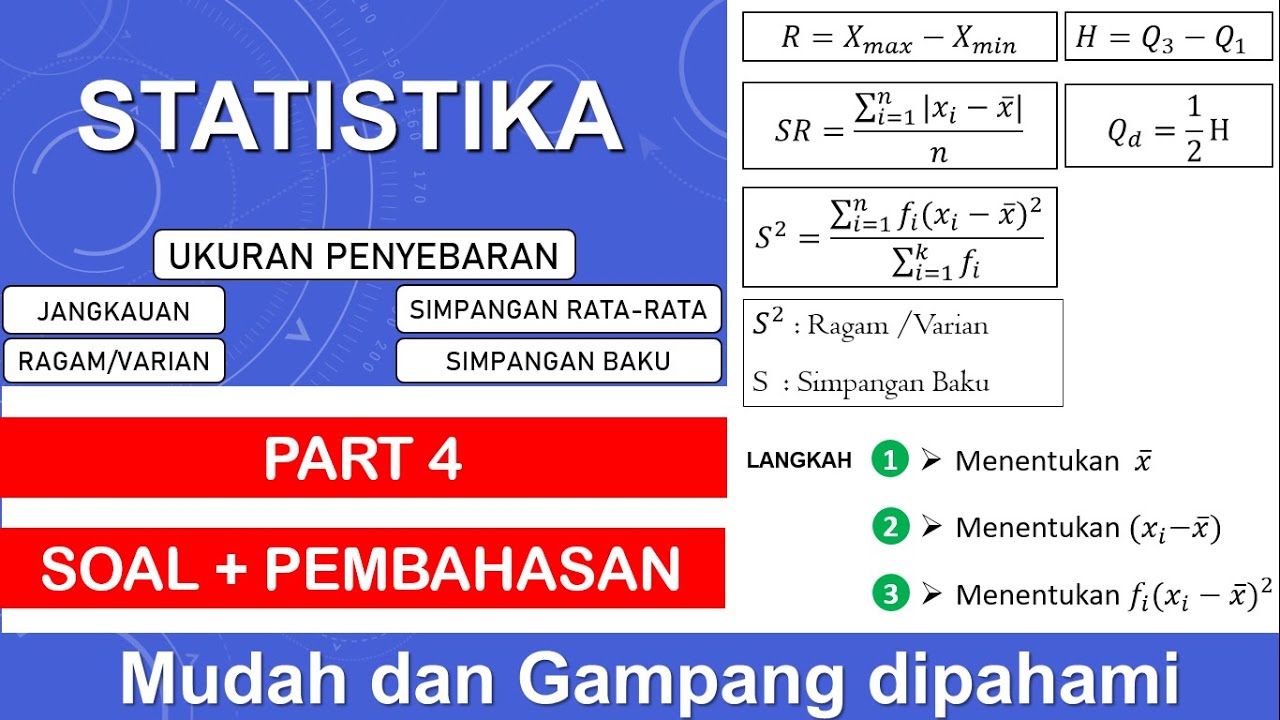
Statistika Part. 4 | Ukuran Penyebaran, Ragam, Varian, Simpangan Rata-rata, Simpangan Baku
5.0 / 5 (0 votes)
