Math 251 - What is a limit?

Amanda Blaisdell
24 Sept 202006:10

Summary

TLDRIn this Math 251 lesson, the concept of limits in calculus is introduced. The instructor breaks down the formal definition, explaining how a function's values approach a certain real number 'l' as the input 'x' approaches a specific value 'a'. Using both graphical and tabular examples, the lesson illustrates how to determine limits, even when the function is undefined at 'x=a', emphasizing the importance of the function's behavior around 'a' rather than at the point itself.

Takeaways

  • 📘 The concept of a limit in calculus is introduced, focusing on how function values approach a certain number.
  • 📐 A function f(x) must be defined on an interval containing a point 'a', except possibly at 'a' itself.
  • 🔢 The limit 'l' is a real number that represents the y-value the function approaches as x approaches 'a'.
  • 📉 As x values get closer to 'a', the corresponding f(x) values should get closer to 'l'.
  • 📊 The limit is symbolized as 'lim (x→a) f(x) = l', indicating f(x) approaches l as x approaches a.
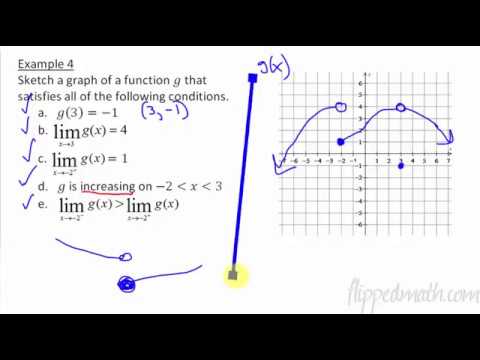
  • 📈 An example is given with a quadratic graph to illustrate how to find the limit as x approaches a specific value.
  • 📋 Even with a table of values, the concept of a limit can be applied to determine what the function values approach.
  • 🚫 The function does not need to be defined at the point 'a'; it's acceptable to have a 'hole' at that point.
  • 📌 The limit exists and is valid even if the function is undefined at the point where x is approaching.
  • 👋 The video concludes with a reminder that there are more lessons to follow on this topic.

Q & A

  • What is the primary focus of the lesson in the transcript?

    -The lesson focuses on explaining the concept of limits in calculus, specifically what it means for the limit of a function f(x) to approach a value l as x approaches a certain point a.

  • How is the definition of a limit presented in the lesson?

    -The definition of a limit is presented as a function f(x) being defined at all points in an open interval containing a, except possibly at a itself, with the function values approaching a real number l as x values approach a.

  • What does it mean for a function to be defined at all values in an open interval containing a?

    -It means the function is defined throughout the interval except possibly at the point a, allowing for a 'hole' at that point without affecting the limit.

  • Why is it okay for the function to have a hole at point a?

    -Having a hole at point a is acceptable because the definition of a limit only requires the function to be defined in an interval around a, not necessarily at a itself.

  • What is the symbolic representation of a limit as x approaches a?

    -The symbolic representation of a limit as x approaches a is written as 'lim (x→a) f(x) = l', indicating that f(x) approaches l as x approaches a.

  • How does the lesson use a graph to illustrate the concept of a limit?

    -The lesson uses a graph to show that as x values get closer to a, the corresponding y values (f(x)) get closer to a specific real number l, which is the limit.

  • What is an example of finding a limit using a graph provided in the lesson?

    -An example is finding the limit as x approaches 6 on a quadratic graph, where it's observed that as x values approach 6 from both sides, the y values approach 2.

  • How can you determine a limit when given a table of values instead of a graph?

    -With a table, you look at how the y values (f(x)) change as the x values approach the point of interest from both sides to see if they consistently approach a certain value l.

  • What does it mean if the function is undefined at the point x equals a?

    -If the function is undefined at x equals a, it means there is a hole or a discontinuity at that point, but it does not prevent the existence of a limit as x approaches a.

  • What is the significance of the y value in the context of limits?

    -The y value is significant because it represents the value that the function f(x) approaches as x approaches a certain point a, which is the essence of the limit concept.

  • How does the lesson emphasize the importance of approaching a from both sides when considering limits?

    -The lesson emphasizes that to find a limit, one must consider how the function values behave as x approaches a from both directions, ensuring the function's behavior is consistent.

Outlines

00:00

📘 Introduction to Limits

This paragraph introduces the concept of limits in calculus, specifically focusing on the definition of a limit from a textbook. The instructor breaks down the definition into digestible parts to make it easier to understand. It starts with defining a function 'f(x)' that is defined on an open interval containing a point 'a', except possibly at 'a' itself. The limit 'l' is introduced as a real number that the function values approach as 'x' approaches 'a'. The concept is then visualized through a graph, where 'x' values get closer to 'a' from both sides, and the corresponding 'y' values (function values) get closer to 'l'. The instructor uses a quadratic graph as an example to illustrate how to find the limit as 'x' approaches a certain value, showing that the limit can be determined by observing the 'y' values as 'x' values approach the point in question.

05:01

📐 Practical Example of Limits

The second paragraph provides a practical example of finding a limit using a table of values instead of a graph. The instructor explains how to determine the limit as 'x' approaches a certain value by looking at the 'y' values in the table. It is noted that even if the function is undefined at the exact point 'x' equals 3, the limit can still be determined and is valid, as long as the function is defined on an interval around that point. The example shows that the 'y' values approach a certain number regardless of whether the function is defined at the exact point or not. This highlights the importance of understanding that the existence of a limit does not depend on the function being defined at the point itself, but rather on the behavior of the function as it approaches that point.

Mindmap

Keywords

💡Limit

A limit in calculus refers to the value that a function or sequence 'approaches' as the input (or index) approaches some value. In the video, the concept of a limit is central to understanding how a function behaves as it gets closer to a certain point without necessarily being defined at that point. The script explains that if the function values approach a real number 'l' as 'x' approaches 'a', then 'l' is the limit of the function at 'a'.

💡Function

A function in mathematics is a relation between a set of inputs and a set of permissible outputs with the property that each input is related to exactly one output. In the context of the video, 'f(x)' represents a function that is defined on an interval, possibly excluding a specific point 'a'. The video uses the function to illustrate how the concept of a limit applies to its behavior as 'x' approaches 'a'.

💡Open Interval

An open interval is a set of all real numbers between two numbers, including neither of the endpoints. The script mentions that a function is defined at all values in an open interval containing 'a', which means it covers all numbers in a range around 'a' but not including 'a' itself, unless specified.

💡Real Number

A real number is a value that represents a quantity along a continuum, such as a line. In the video, 'l' is described as a real number that the function values approach as 'x' approaches 'a'. It is the y-value on the graph that the function tends towards, which is a key part of defining a limit.

💡Approach

In the context of limits, 'approach' means to get arbitrarily close to a certain value without necessarily reaching it. The script uses this term to describe how the input values of 'x' can get closer and closer to 'a' from either side, which is essential for defining what a limit is.

💡Symbolically Represent

Symbolic representation in mathematics often involves using symbols or notation to denote mathematical concepts or operations. The video explains that the limit of 'f(x)' as 'x' approaches 'a' is symbolically represented as 'lim (x→a) f(x) = l', which is the standard notation for expressing limits.

💡Graph

A graph in mathematics is a visual representation of the relationship between two or more variables. The video uses the term 'graph' to describe the visual tool that helps understand how function values (y-values) approach a certain limit (y-value) as the input values (x-values) approach a specific point.

💡Undefined

In mathematics, a function is said to be undefined at a certain point if it does not have a value for that point. The script mentions that even if a function is undefined at 'x = 3', it is still possible to talk about the limit at that point, which is an important nuance in understanding limits.

💡Hole

A hole in a function's domain refers to a point where the function is not defined. The video script uses the term 'hole' to describe a point at 'x = 3' where the function is undefined, yet the limit can still be determined as 'x' approaches this point.

💡Table

A table is a collection of data points displayed in rows and columns. In the video, a table of values is used as an alternative to a graph to illustrate how to find the limit of a function as 'x' approaches a certain value. The table provides a set of 'x' and corresponding 'f(x)' values to analyze the approach to the limit.

💡Y-value

The y-value in a function refers to the output value corresponding to a given input value. The video emphasizes that when determining a limit, one is interested in the y-values of the function as the input 'x' approaches a certain point 'a'.

Highlights

Introduction to the concept of limits in calculus

Definition of limit from a textbook, broken down for easier understanding

Explanation of a function being defined on an open interval containing a point 'a'

Clarification that the function can have a hole at point 'a'

Definition of 'l' as a real number representing the y-value the function approaches

Description of how values of 'f(x)' approach 'l' as 'x' approaches 'a'

Graphical representation of the limit concept

Visual demonstration of how 'f(x)' approaches 'l' from both sides of 'x=a'

Symbolic representation of the limit: lim (x→a) f(x) = l

Example of finding the limit of a quadratic function as x approaches 6

Explanation of how to interpret the limit from a graph

Example of finding the limit using a table of values

Explanation of how the function can be undefined at 'x=3' but still have a valid limit

Emphasis on the importance of the function being defined on an interval, even if it excludes point 'a'

Conclusion of the lesson with a reminder of the key points

Invitation to watch more lessons on the topic

Transcripts

play00:00

hi everyone welcome back to math 251

play00:03

in today's lesson we are talking all

play00:04

about something called a limit

play00:06

and this first definition here is

play00:08

straight from the textbook

play00:09

it's a little bit long and complicated

play00:10

so i wanted to go through it and

play00:13

see what it's in piece by piece so let's

play00:15

read it together and then we'll go

play00:16

through it a little bit at a time

play00:18

it says let f x be a function defined at

play00:21

all values in an open interval

play00:22

containing a

play00:23

with the possible exception of a itself

play00:25

and let l be a real number

play00:27

if all values of the function f of x

play00:29

approach the real number l

play00:30

as the values of x possibly not equal to

play00:33

a

play00:34

approach the number a then we say that

play00:35

the limit of f x as

play00:37

x approaches a is l more succinct

play00:40

as x gets closer to a f x gets closer

play00:43

and stays close to

play00:44

l symbolically we can represent this

play00:47

idea as the limit as

play00:48

x approaches a of f of x is equal to l

play00:52

so what is all of this sand let's go

play00:55

through it a little chunk at a time

play00:57

it first says let f x be a function

play00:59

defined at all values in an open

play01:01

interval containing a

play01:02

with the possible exception of a itself

play01:05

so basically if

play01:06

the function that we are looking at here

play01:08

is f x

play01:10

this piece is saying that we have to be

play01:12

defined on some interval

play01:14

that we are concerned with maybe some

play01:15

interval like this

play01:17

except it's okay if we have a hole

play01:21

at the point a we just have to be

play01:24

defined everywhere else

play01:27

next little chunk here says that l is a

play01:29

real number

play01:30

well that just means exactly what it

play01:32

sounds like l is a number here

play01:34

the important thing to remember when we

play01:35

are looking at this number l

play01:38

is that l is always going to be the y

play01:41

value

play01:42

on the graph that we are concerned with

play01:45

next

play01:45

it says that if all values of f of x

play01:48

approach the real number

play01:49

l as the values of x approach the number

play01:51

a

play01:52

then we have this limit that we're

play01:54

talking about so

play01:55

let's um let's draw a little bit on this

play01:57

graph here

play01:59

it says if all values of the function f

play02:01

of x

play02:02

approach the real number l as the values

play02:05

of x

play02:05

approach the number a so we are getting

play02:08

really close

play02:10

in the x direction to this number a

play02:13

from both sides that's what's happening

play02:16

here

play02:17

so that is our chunk here

play02:20

as the values of x approach the number a

play02:24

and and we want the y values to get

play02:27

really close to our number

play02:29

l so what's happening in the y direction

play02:32

here

play02:32

well if we follow our graph as x gets

play02:35

really close

play02:36

to a from this direction we can see that

play02:38

on the graph yeah we are approaching

play02:40

this number

play02:40

l and as we approach a from the other

play02:43

side of the graph

play02:44

we are also getting really close to that

play02:46

y value of l

play02:49

so this is what it looks like on a graph

play02:51

and if this is true

play02:53

if all of the y values approach this

play02:56

number l

play02:57

as all of the x values get really close

play02:59

to this value a

play03:01

then we can write this limit we read

play03:03

this as the limit

play03:04

as x approaches a of f x is equal to

play03:08

l so this is kind of a visual

play03:11

representation of what a limit actually

play03:13

is

play03:14

um so now let's do a few examples

play03:17

here we have this graph it is a

play03:19

quadratic graph

play03:21

and we want to know what the limit as x

play03:23

approaches 6 of f of x

play03:24

is well first of all we know that this

play03:28

limit is going to be

play03:29

a y value

play03:33

y value and we want to know what the y

play03:36

value of this function is

play03:37

as the x value gets really close to 6.

play03:41

so if i were to go on my x-axis here i'm

play03:44

getting really close

play03:45

to this value of 6 from both sides

play03:50

so i'm approaching 6 and then what

play03:52

happens on

play03:53

my graph well if i approach x equals 6

play03:57

from this side of the graph i see that

play03:58

i'm getting really close to that y value

play04:00

of 2

play04:01

and if i approach x equals 6 from this

play04:03

side of the graph

play04:04

i also see that i get this y value of

play04:08

2. so that means that the limit

play04:11

as x approaches 6 of our function

play04:15

f of x is equal to 2

play04:20

where this 2 is the y value that

play04:21

corresponds to

play04:23

that ordered pair as x approaches 6.

play04:26

what about a table what if we were given

play04:28

this table instead

play04:30

and asked to find the limit as x

play04:32

approaches 3 of

play04:33

f x so here we don't have

play04:36

a visual representation but we can still

play04:38

figure it out um again we want the y

play04:41

value here

play04:43

and we can see that in this table all of

play04:46

our x values

play04:47

on both sides a little bit less than

play04:51

and a little bit greater than the value

play04:53

that we care about

play04:54

are all approaching the number three so

play04:57

here all of our x values are getting

play04:58

really really really close to three

play05:00

and what's happening to our y values

play05:03

well on this

play05:04

side they are slightly less than the

play05:06

number six

play05:08

and on this side they are slightly

play05:10

greater than the number six

play05:12

regardless from both sides of x equals

play05:15

three

play05:16

our y value is approaching six so that

play05:19

is our answer here

play05:20

we have the limit as x approaches

play05:24

3 of f of x

play05:27

is equal to 6. now it's worth noting

play05:30

that if we look at this graph

play05:32

at x equals 3 our function is undefined

play05:35

that is okay all this means is that

play05:38

there is a hole

play05:40

at x equals three and if we think back

play05:42

to that definition that we read

play05:44

at the beginning of this video it says

play05:46

that we just need f to be defined on

play05:48

some interval

play05:49

and it's okay if that interval does not

play05:51

include that point

play05:52

a so here we just have that hole at x

play05:55

equals three

play05:55

which means that it's undefined and that

play05:58

does not affect

play05:58

the fact that we still have this limit

play06:00

that is valid so that's pretty important

play06:02

to keep in mind

play06:04

that's it for this video we have a

play06:05

couple more for today so go ahead and

play06:06

watch those

play06:08

bye

Rate This

5.0 / 5 (0 votes)

الوسوم ذات الصلة
CalculusLimitsMathematicsEducationFunctionApproachGraphTableConceptTutorial
هل تحتاج إلى تلخيص باللغة الإنجليزية؟