5-S&D Structure Zones Theory Pt1

kapı eşiği
23 Jun 202411:28

Summary

TLDRThe script focuses on the importance of understanding market structure zones in trading. It emphasizes that merely identifying zones and entry models isn't sufficient; traders must grasp the overall narrative of price action. The instructor discusses how to overlay supply and demand onto market structure diagrams to enhance trading decisions. Examples are provided to illustrate the concept of anticipating price movements based on demand zones leading to structure breaks and anticipating pullbacks using significant supply zones.

Takeaways

  • 📈 **Importance of Market Structure**: Understanding market structure is crucial as it forms the foundation for analyzing price action.
  • 🔍 **Live Market Challenges**: Despite theoretical knowledge, traders often struggle with live markets due to lack of practical application and understanding of price narratives.
  • 📊 **Overlaying Supply and Demand**: Supply and demand concepts are layered onto market structure to enhance the framework for better decision-making.
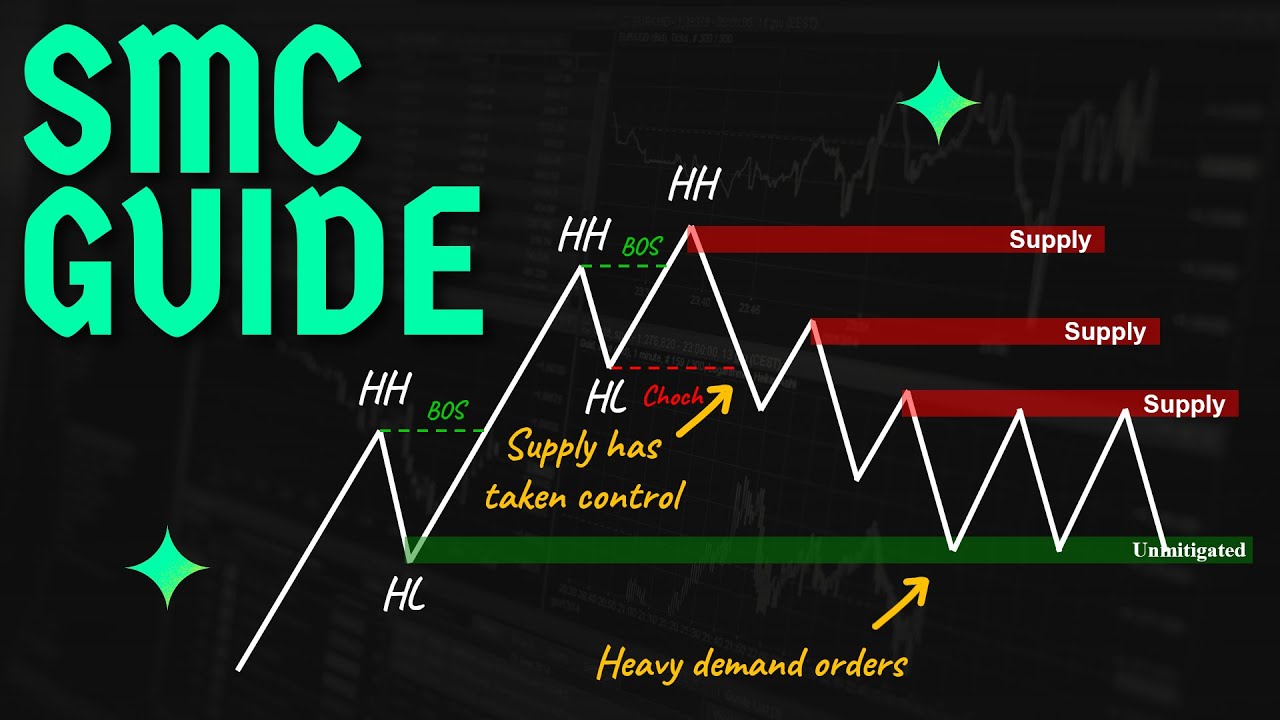
  • 📉 **Bullish Market Structure**: In a bullish market, demand controls the price, and weak highs are expected to fail, providing entry points for long positions.
  • 📈 **Demand Zones Identification**: Identifying demand zones that led to a structural break is key for potential long entry points when prices return to these areas.
  • 📉 **Bearish Market Structure**: Conversely, in a bearish market, supply dominates, and weak lows are anticipated to fail, signaling potential short opportunities.
  • 🔄 **Dynamic Market Interpretation**: The same zones that signal continuation trades in a trend can act as catalysts for pullbacks when the trend reverses.
  • 🔍 **Mitigation of Zones**: As prices interact with zones, they get mitigated, reducing their effectiveness for future trades, which influences how traders should view these areas.
  • 🎯 **Anticipating Pullbacks**: Traders can anticipate potential pullbacks by looking at significant supply or demand zones that might act as catalysts for trend reversals.
  • 📌 **Focus on Unmitigated Zones**: For counter-trend trades, it's more effective to focus on unmitigated zones that haven't been tested recently, as they are more likely to cause significant price reactions.

Q & A

  • What is the main issue traders face when applying market structure in live markets?

    -The main issue traders face is not having a solid grasp of the overall narrative of price action. They might understand the entry model and see the price come into the zone, but they struggle with why they're taking lots of losses and getting thrown around in the market.

  • Why is it important to understand market structure?

    -Market structure is the base case, framework, and building block for trading. It forms the foundation of understanding price action, which is crucial for anticipating market movements and making informed trading decisions.

  • What is meant by 'overall narrative of price action'?

    -The 'overall narrative of price action' refers to the comprehensive understanding of how price moves in the market, including trends, patterns, and the interplay between supply and demand.

  • What is the significance of a demand zone that led to a break of structure?

    -A demand zone that led to a break of structure is significant because it indicates a point where buyers were strong enough to push the price higher. When the price comes back into this zone, it presents a potential buying opportunity as it is expected to find support and continue the upward movement.

  • How do you identify a valid institutional demand zone?

    -A valid institutional demand zone is identified by its role in causing a break of structure. It is a zone where significant buying pressure was evident, leading to a price breakout.

  • What is the expectation when price falls back to demand in a bullish market?

    -In a bullish market, when price falls back to demand, the expectation is that any supply in the way will fail, and the weak highs will be broken as the price continues its upward trend.

  • What is meant by 'mitigations' in the context of supply and demand zones?

    -Mitigations refer to the process where a previously significant supply or demand zone has been partially or fully filled with orders, causing the price to move in the direction of the prevailing trend. As orders are filled, the zone's potential impact on future price movements diminishes.

  • Why is it important to not overcomplicate the analysis with multiple timeframes or structures?

    -Overcomplicating the analysis with multiple timeframes or structures can lead to confusion and incorrect trading decisions. Focusing on one type of structure and one timeframe helps in maintaining clarity and making more precise trading decisions.

  • What is the role of a supply zone in a bearish market?

    -In a bearish market, a supply zone acts as a resistance level where sellers are expected to dominate. When price pulls back up to a supply zone, it is anticipated to respect this level, leading to further price decline.

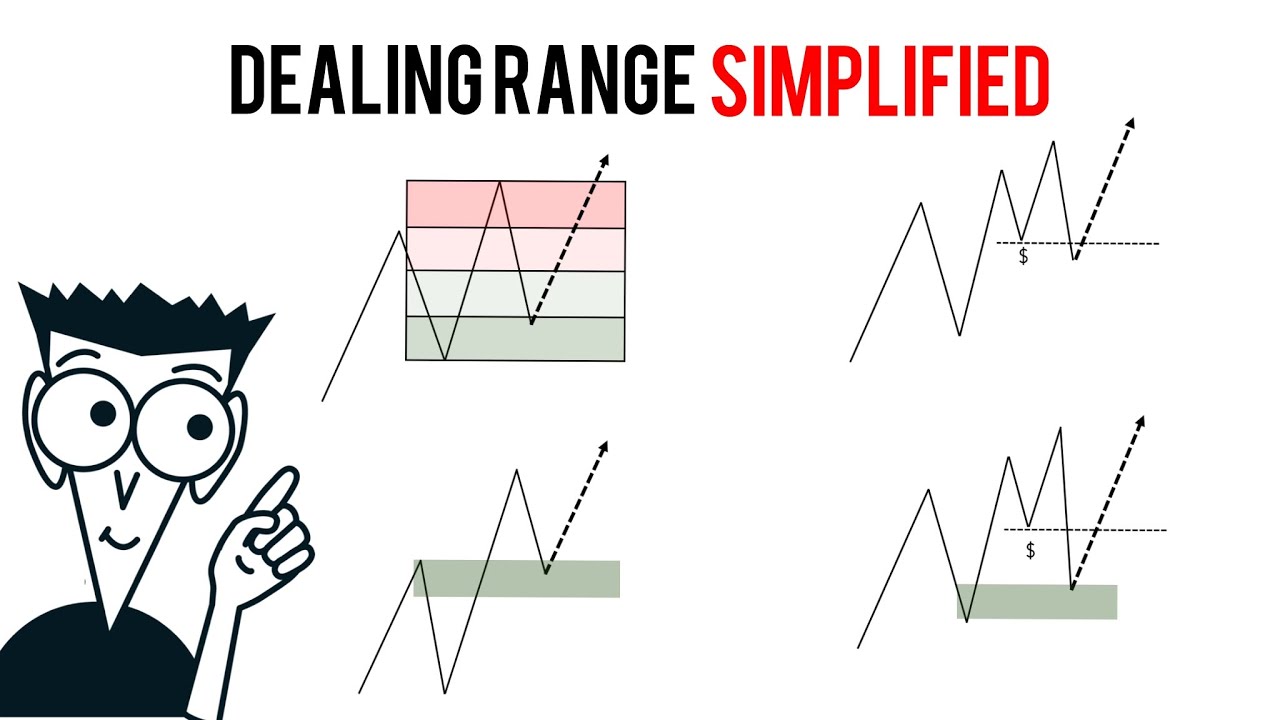
  • How can supply and demand zones help anticipate a pullback after a break of structure?

    -Supply and demand zones can help anticipate a pullback by identifying significant zones on the chart. After a break of structure, traders can look for the nearest significant supply zone to anticipate where the pullback might start.

  • What is the difference between a supply zone in a bearish trend versus a new bullish trend?

    -In a bearish trend, a supply zone is seen as a continuation area where price is expected to continue falling. In a new bullish trend, the same supply zone is viewed as a potential starting point for a pullback, not as a continuation area.

Outlines

00:00

📈 Understanding Market Structure and Zones

The speaker emphasizes the importance of having a deep understanding of market structure before applying supply and demand concepts to trading charts. They discuss how traders often struggle with live markets despite theoretical knowledge. The focus is on the necessity of grasping the overall narrative of price action rather than just identifying zones and entry models. The speaker highlights the significance of market structure as the foundational framework for trading decisions, suggesting that a solid grasp of this concept is essential for success in the market.

05:03

📉 Applying Supply and Demand to Market Structure

This section delves into how to overlay supply and demand onto market structure diagrams. The speaker uses examples to illustrate how to identify potential entry points by looking at previous price legs and identifying demand zones that led to a break in structure. They explain that in a bullish market structure, demand is in control, and weak highs are expected to fail, providing opportunities for long positions. Conversely, in a bearish market structure, supply is dominant, and price pullbacks to supply zones are expected to fail, indicating potential short opportunities. The speaker also discusses the concept of mitigation, where a demand zone that has already triggered a move is less likely to be effective for future trades.

10:03

🔍 Identifying Pullback Zones and Anticipating Market Shifts

The speaker discusses how to anticipate and identify pullback zones in the market using supply and demand analysis. They explain that after a break of structure, traders should look for shifts in market character and use supply and demand to predict where the pullback might start. The speaker illustrates this by identifying significant supply zones that can act as catalysts for a pullback. They also touch on the concept of completely unmitigated zones, which are more likely to cause significant price movements. The section concludes with a discussion on how to manage expectations and trade countertrends by focusing on fresh, unmitigated zones rather than those that have already been partially filled.

Mindmap

Keywords

💡Market Structure

Market Structure refers to the pattern of higher highs and higher lows that prices make in a bullish trend, or lower highs and lower lows in a bearish trend. It is the foundational concept of technical analysis in trading, providing a framework for understanding price action. In the video, the speaker emphasizes the importance of having a deep understanding of market structure as it serves as the base case for analyzing price movements and anticipating future trends.

💡Price Action

Price Action is the movement of prices on a chart, which reflects the collective behavior of all market participants. It is a core concept in trading as it provides insights into the market's sentiment and potential future direction. The video script discusses the importance of understanding the 'overall narrative of price action' to make informed trading decisions, rather than just relying on simple entry models.

💡Supply and Demand Zones

Supply and Demand Zones are areas on a price chart where there is a concentration of buying or selling pressure. These zones are significant for traders as they often act as support or resistance levels. In the script, the speaker explains how to overlay supply and demand zones onto market structure to enhance the understanding of potential price reversal points or continuation areas.

💡Entry Model

An Entry Model is a specific set of criteria or conditions that a trader uses to identify a potential entry point for a trade. The video script mentions that while traders may understand entry models, they often fail to consider the broader context of market structure and price action, which can lead to taking trades that result in losses.

💡Swing High/Low

Swing High and Swing Low are terms used to describe significant peaks and troughs in price movement within a trading range. They are used to define the boundaries of a trading zone. The script uses these terms to illustrate how to identify potential areas for entering trades based on the current market structure.

💡Demand Zone

A Demand Zone is an area on a price chart where there is significant buying interest, often leading to price support. The video script explains how to identify demand zones that have led to a 'break of structure' and how these zones can be used to anticipate future price movements and potential entry points for long positions.

💡Supply Zone

A Supply Zone is an area on a price chart where there is significant selling pressure, often leading to price resistance. The speaker in the video uses the concept of supply zones to discuss how to anticipate potential selling points or areas where the price may reverse after a breakout.

💡Break of Structure

A Break of Structure occurs when the price moves beyond a previously established high or low, indicating a potential shift in the market trend. The script discusses how to identify these breaks and how they relate to supply and demand zones, which can signal new trading opportunities.

💡Mitigation

Mitigation, in the context of the video, refers to the process where a previously significant supply or demand zone has been 'filled' or partially exhausted as the price moves through it. The speaker explains that a mitigated zone may not have the same impact as a fresh, unmitigated zone when it comes to causing a price reversal or continuation.

💡Confluence

Confluence in trading refers to the simultaneous occurrence of multiple technical indicators or events that suggest a high probability of a price reversal or continuation. The script mentions looking for confluence as a way to rank potential trading zones by probability and to seek more confirmations when trading.

💡Pullback

A Pullback is a temporary reversal in the price trend, often seen as a buying opportunity in an uptrend or a selling opportunity in a downtrend. The video script discusses how to anticipate pullbacks using market structure and supply and demand zones, and how to manage expectations about where the pullback might start.

Highlights

People often struggle with live market trading despite understanding theoretical concepts.

The importance of having a solid grasp of overall price action narrative.

Market structure is the foundation for trading strategies.

Supply and demand analysis is overlaid on market structure for deeper insights.

In a bullish market, demand controls and weak highs are expected to fail.

Identifying demand zones that led to a break of structure for potential long entries.

Expectations for price to continue in the direction of the prevailing trend after a pullback.

In a bearish market, supplies control and weak lows are expected to fail.

Looking for potential supply zones where price may pull back in a bearish trend.

The concept of a demand chain and its significance in market analysis.

Mitigations in the market and how they affect the validity of zones for trading.

The shift in perspective of supply zones from continuation to pullback catalysts.

Using supply and demand to anticipate the start of a pullback in a new trend.

The difference in trading confidence between mitigated and unmitigated zones.

The expectation for price to move to the upside after a break in a bearish market.

Using shifts in market structure to signal a potential trend change.

The role of supply and demand in identifying the start of a countertrend pullback.

Transcripts

play00:00

All righty so now we're gonna look at structure zones and we go through some

play00:04

theory before we hop on the charts in the next lesson kind of just wanted to

play00:10

preface this with in all the time I've been spending mentoring and looking at

play00:15

other people what I see is people can do the work they can study they can go

play00:19

through the course you know it all makes sense it all makes logical sense they

play00:23

get it they go through lessons blah blah blah blah and then they hop into the

play00:26

live market and basically they'll draw on their zone they understand the entry

play00:33

model they'll see price come into the zone they'll see the entry model present

play00:37

itself they'll take the trade and then they wonder why you know they're taking

play00:41

lots and lots of losses and just getting thrown around and really it comes back

play00:45

to is that it's not just as simple as identifying let's say a zone that broke

play00:50

a structure that broke some structure drawing on your zone waiting for price

play00:53

to hit it come back into it and then just looking for your entry model you

play00:58

need to really have a solid solid grasp of the overall narrative of price action

play01:05

okay so I guess what I'm trying to get is there's a reason why we spent so so

play01:09

so so long just going over market structure and just going over again and

play01:14

again looking at three types of structure and trying to give you that

play01:16

really deep understanding of it because market structure is your base case it's

play01:21

framework it's your building block it's the bottom of your foundation and as

play01:25

you're gonna see now we're gonna go through very similar diagrams that you

play01:28

should be familiar with from the market structure module but we're just

play01:31

overlaying supply and demand onto that you know we're just adding it in to that

play01:35

framework because what can happen is when you're in live market and I'm you

play01:40

know just as just as guilty of it as well is you can have your zone drawn on

play01:44

yes it's a valid zone it broke structure blah blah blah and as price comes into

play01:47

it you know you just want to trade it but actually you need to take into

play01:51

consideration everything anyway I don't want to kind of just keep ramming on but

play01:55

we'll go through it and I kind of just want to make the point of you might be

play01:58

used to some of these diagrams but I think it's worth going over these

play02:02

examples again and again again I'm really just trying to embed it deep into

play02:06

your psychology and your subconscious as much as possible so the basics will be

play02:10

we'll go pretty quick on this because you should be familiar with this but

play02:13

essentially basic market structure all right we know price makes higher highs

play02:17

higher lows higher highs higher lows higher highs higher lows and higher

play02:20

highs now what we're saying when we're just thinking about market structure we

play02:23

were saying that this is a weak high why well it hadn't done its job and it

play02:27

broke any structure okay so when price is coming back we know that we expect

play02:33

it to fail so without even drawing on supply and demand we know that when

play02:37

price is bullish like this we know that demand is in control okay so when price

play02:42

is pulling back set this section we're gonna look back I'm gonna go okay where

play02:45

did the demand step in so we're looking at this previous leg okay let me let me

play02:49

reset this when price is putting back like this okay we know market structure

play02:54

is bullish we want to get long so if we look back in the previous price leg

play03:00

within the current range we were then okay because we're always just looking

play03:03

at the range we're within so we know where our swing low is we know where our

play03:06

swing high is price is currently here so we know it's in swing pullback phase

play03:09

we know price is bullish and we want to get long okay so where are the areas in

play03:13

which we can get long well we look in the previous leg within the current

play03:17

range we are within okay and we identify where in this leg are there

play03:21

demand zones okay so in this instance I kept it simple and I've just drawn on

play03:24

one zone I've just drawn on the extreme zone all right obvious place to try and

play03:28

look for buys is this a valid institutional demand zone yes why well

play03:34

it led to a break of structure okay so in its most simplest form we're looking

play03:38

for those demand zones that led to a break of structure when price comes back

play03:41

into it this is where we live to get long and then we can target what we can

play03:44

target the weak high and there may be supply here right it might have broken a

play03:48

fractal piece of structure here or an internal piece of structure but

play03:51

ultimately we expect that to fail once prices fall back to demand it's

play03:56

fulfilled its objective it's you know it's performed its swing pullback as we

play04:00

start moving to the upside with we're gonna start to expect any supplies is in

play04:04

the way that they're ultimately gonna fail until we break the high once we

play04:08

break the high right there might be supply to the left that's when we can

play04:11

potentially expect pricing and pullback okay at that moment so yeah we'll go

play04:16

again we'll go into more complex examples in a minute but essentially

play04:19

bullish market structure demand is in control we expect supply to fail expect

play04:23

those weak highs to fail and for price to continue exact opposite for bearish

play04:27

market structure supplies in control right price pulls back up to supply it's

play04:32

respected and demand fails now when we have some more slightly complex examples

play04:40

let's say when price is up here and price is then starting to pull back and

play04:43

we want to look for where is that next swing high low going to form in reality

play04:46

there can be one two three four five depending on how big the range is there

play04:50

can be multiple multiple supply and demand zones that we have to look at

play04:54

where price could potentially come and pull back to and we will never know

play04:57

where exactly price is gonna pull back to we never know we can only identify

play05:03

the zones look for the confluence that we look for and try and kind of rank

play05:06

them in order of probability and obviously look for more confirmations

play05:09

when price gets in there because this is a demand zone here right that led to

play05:13

that break of structure but as we can see it's already being mitigated okay so

play05:17

when we're at this moment and we're looking for where are the demand zones

play05:20

well we have this demand zone here but it's already had its orders filled and

play05:23

it's already caused its move so what I would do is I would draw it on but I'm

play05:27

not gonna extend the zone any further left because it's done its job it's

play05:30

there right so this is what I was talking about a series of mitigations

play05:33

right it's been tapped into the orders have been filled and we move up so we're

play05:37

starting to potentially form a demand chain now so this is one potential POI

play05:40

we can look at it led to a break of structure and it's part of a previous

play05:44

mitigation and then we could also look at this zone here down at the extreme

play05:47

okay right at that strong swing low at that moment right price could have pulled

play05:51

all the way back into down to here before continuing okay and again we then

play05:56

expect supply to fail and then likewise over here right there could have been a

play05:59

supply zone here I haven't drawn it on where we could look for shorts but it

play06:02

may not play out again has a little bit reaction pushes up higher right there

play06:06

could have been another supply zone here in this case doesn't play out price

play06:09

pushes through and in this instance it comes all the way up to the extreme

play06:11

right where that strong high is with the current swing high and then we

play06:14

eventually go and that's when we start to expect these demand zones to fail

play06:17

okay cool hopefully that shouldn't be too confusing as of yet if you've kind

play06:23

of got the the market structure basics nailed down okay so here's another

play06:28

reasonably basic market structure example with obviously with supply and

play06:32

demand zones so again just think about one type of structure just think about

play06:36

swing structure for instance and just think about one time frame okay don't

play06:40

over complicate it any more than that and let's go through it so bearish

play06:44

market structure all right we move to the downside we have that swing pullback

play06:48

and then we eventually leads to a break of structure obviously we have a bit of

play06:53

a pullback here so now our swing low is here and our swing high is up here okay

play06:58

so when price is starting to pull back we've got two potential POIs we've got

play07:03

this POI here this supply zone right because it's at the you know the pivot

play07:07

of this move that led to the break of structure and then we also have the

play07:10

extreme as well okay so sort of two main supply levels that we're looking for

play07:14

price to pull back to again we never know which one it will be there's other

play07:17

confluences that we can use such as premium discount and liquidity stuff

play07:21

that you're gonna learn in the future lessons but essentially that's two

play07:24

levels price ends up pulling back whoops wrong one price ends up putting back

play07:28

into the zone here right and then again we get another break of structure so

play07:34

let me get rid of these drawings once we break that level again was between this

play07:39

swing low and this swing high two potential supply zones we've got this

play07:42

pivot that led to the break of structure and then we have the extreme as well

play07:45

price ends up putting back into here and then continuing down so again this

play07:49

becomes our strong high this becomes our low price comes into that supply zone we

play07:53

can look for shorts and we can look to target the weak low but at some point

play07:56

that's gonna fail and the trend is gonna change okay now at this moment when the

play08:02

trend changes okay I'm looking for longs what do we expect after a break of

play08:07

structure we expect a pullback on that time frame so where can what can we you

play08:11

know do to expect when that pullback may be about to start hopefully if you look

play08:17

at the market structure modules you will look we can look for shifts of

play08:19

structure so we can look for bearish changes of character right or ideally we

play08:23

get a bearish eye boss right so that's what we look for as a piece of

play08:26

confidence for structure but another thing now that we can use is we can use

play08:30

supply and demand to try and anticipate ahead of time where that pullback is

play08:34

gonna kick in okay so at this exact moment when we when we break through and

play08:39

we look left there are no supply zones so what we want to do is we want to look

play08:42

for where is the nearest and significant supply zone it's gonna be this supply

play08:45

zone here so what I'm gonna do is I'm gonna draw it across okay now do you see

play08:50

how I'm gonna make it an empty box just to kind of show you that now this

play08:53

becomes what we call like don't really have a name for this but we could call

play08:56

it like a pullback zone because previously I just bring it back when we

play09:01

were over here okay my price was down here and this was also in high and this

play09:06

was also in low and we were bearish we were looking to potentially short this

play09:10

zone and this zone and if price comes into it we're looking for those big

play09:14

moves right we're looking for the continuation of the trend but now we're

play09:17

not in a bearish trend anymore now we're in a new bullish trend over here so when

play09:22

we now look at this zone we don't view it in the same way we don't view it as

play09:25

price gonna come in and continue down we simply view it as an area in which a

play09:29

pullback can start from okay now some of you that might seem obvious but you'd be

play09:34

surprised at how many times you can be in a live market and people can be

play09:37

treating them in very very different ways and managing their expectations

play09:40

wrongly okay so we look left to a significant zone and now the supply zone

play09:44

simply becomes a catalyst to play that pullback okay so likewise then we pull

play09:49

back and then we're looking for demand zone so we've got one here and you know

play09:52

there'd be potentially one at the extreme and there's two possible levels

play09:55

in which that that high low could form okay in this instance it forms here and

play10:00

we break up the upside again when we break we can start to look for structures

play10:03

to shift to the downside so we can look for bearish chocks or bearish eye bosses

play10:06

to give us that first signal a pullback is occurring but we can now also use

play10:10

supply and demand as soon as price breaks up here we want to look left and

play10:14

we want to look for where is the nearest significant supply zone now there is one

play10:19

here but we've already had a mitigation of that zone okay we've already filled

play10:22

up a lot of the orders because it led to that movement here now when price is at

play10:26

this moment right there might still be some orders within the zone okay because

play10:31

obviously only taps the edge so there might still be some orders from within

play10:33

here and what you might still have market is you might see a little bit of

play10:36

a pullback but typically not always but typically the zones that are going to

play10:41

cause that big actual swing pullback to occur are usually the ones that are

play10:44

completely unmitigated the ones that are completely fresh okay normally so if I

play10:48

was looking to get play countertrends which is obviously a bit can be a bit

play10:51

hard and a bit more risky I'm gonna have a lot more confidence doing it not when

play10:56

price is currently here in this zone because that's already filled up a lot

play11:00

of the orders it's already absorbed the supply within it's already caused that

play11:03

move I'm gonna be more concentrating on this zone up here okay so I'll be aware

play11:08

of it and I'll have it in the back of my mind you know that potentially price

play11:11

could reverse from within here but it's much more likely to be a completely

play11:14

unmitigated zone up here okay and then we compare the pullback down into demand

play11:18

and obviously we know that demand is in control and we expect price to go there

play11:22

to the upside

Rate This

5.0 / 5 (0 votes)

الوسوم ذات الصلة
Market AnalysisTrading StrategiesPrice ActionSupply DemandTrading ZonesMentoring InsightsFinancial EducationInvestment TipsMarket StructureTrading Psychology
هل تحتاج إلى تلخيص باللغة الإنجليزية؟